
Fig 1. Effects of inulin diets and omeprazole treatment on the Mg2+ homeostasis of C57BL/6J mice.
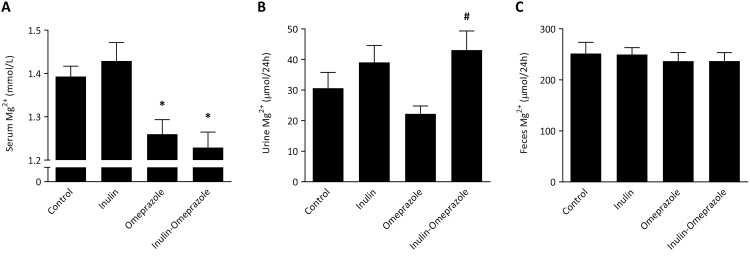
Serum Mg2+ concentration (A), 24 h urinary Mg2+ excretion (B) and 24 h fecal Mg2+ excretion (C). All values are presented as means ± SEM (n = 10 per group). Significant differences between control vs. both omeprazole groups are indicated by * with P < 0.05, significant differences between the omeprazole-treated groups are annotated by # with P < 0.05.