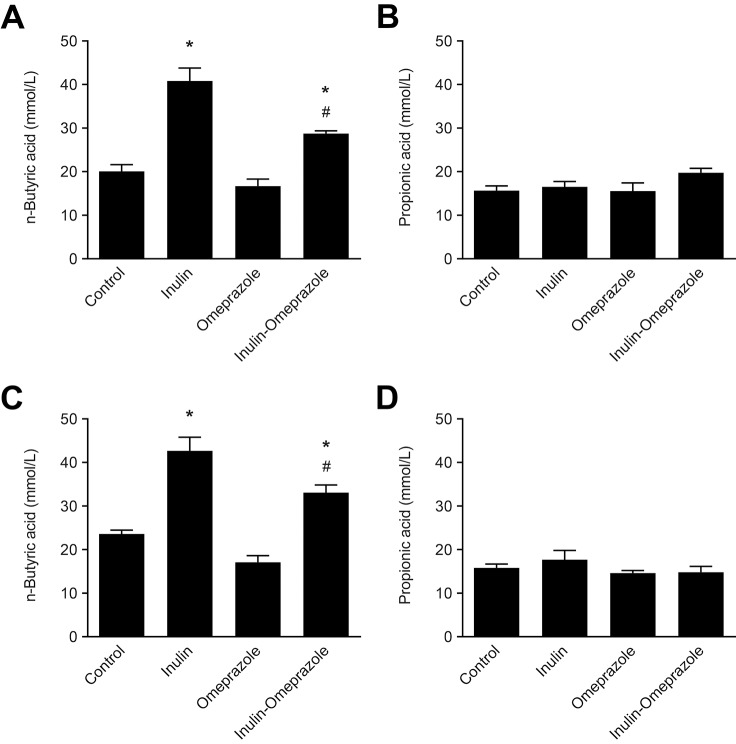
Fig 5. Effects of the combinatory application of omeprazole and inulin-enriched diets on short-chain fatty acid production.
Depicted are n-butyric acid (A + C) and propionic acid concentrations (B + D) in cecum (top panels) and colon (bottom panels) in mmol/L. Significant differences compared to the control group are indicated by * with P < 0.05, significant differences between the omeprazole-treated groups are annotated by # with P < 0.05. Bars represent means ± SEM, with n = 10 mice per group.

