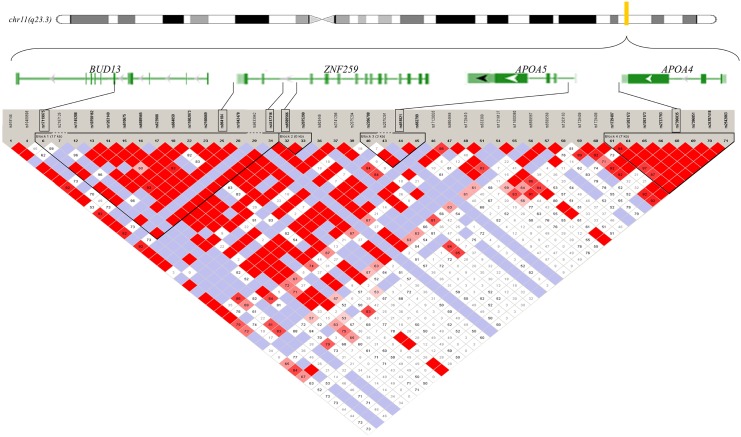
Fig 1. Linkage disequilibrium patterns between genotyped SNPs around the APOA4-APOA5-ZNF259-BUD13 gene cluster in a Chinese Han population.
The location of the genetic markers in the chromosome region (11q23.3) (55 kb) encompasses APOA4, APOA5, ZNF259 and BUD13. The direction of transcription of the genes is shown in arrows. The pair-wise LD between the SNPs is indicated by diamonds shaded in white-gray-red, which show the range of the LD matrix from D’ = 0 in white to D’ = 1 in red. The position of the six SNPs, rs17119975, rs964184, rs4417316, rs6589566, rs651821 and rs7396835, on the genes is indicated by the black rectangles.

