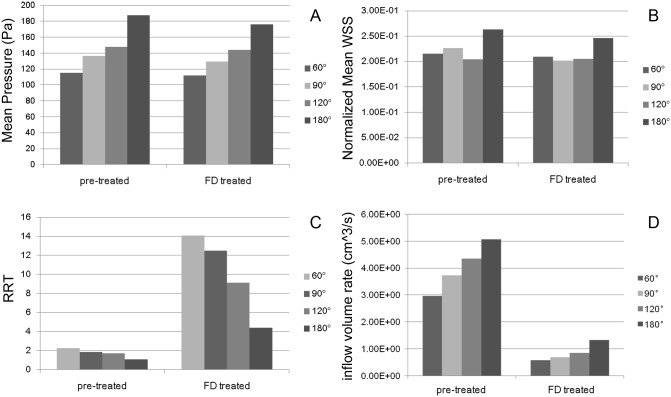
Fig 4. Quantitative hemodynamic results before and after FD treatment.
Each panel shows the hemodynamic results for every parent vessels' curvature considered (first, second, third and forth bars indicate 60°, 90°, 120° and 180° respectively). A, mean pressure. B, normalized mean WSS. C, RRT. D, inflow volume rate.

