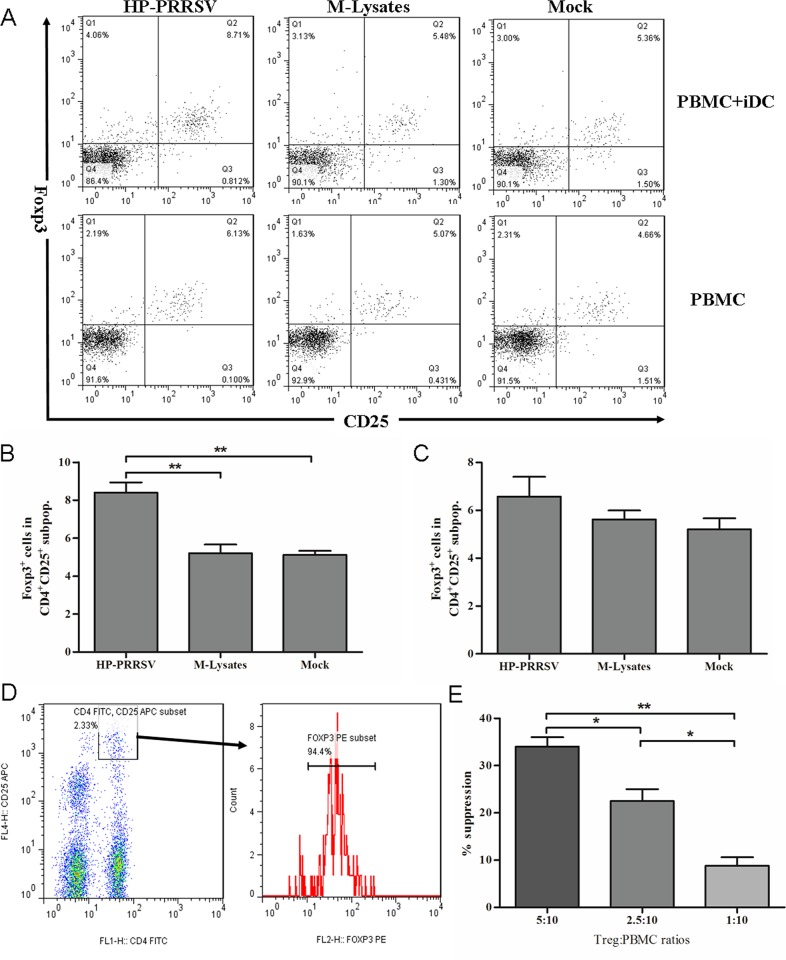
Fig 1. Induction of Tregs from lymphocytes co-cultured with PRRSV-infected MoDCs.
(A) Representative flow cytometry profile of lymphocytes following 3 days co-culture of PBMCs with PRRSV-infected MoDCs (upper layer), and only culture with PRRSV-infected PBMCs (lower layer). (B) Percentage of Foxp3+ cells in the gated CD4+CD25+ subpopulations of PBMCs co-cultured with PRRSV-infected MoDC. (C) Percentage of Foxp3+ cells in the gated CD4+ CD25+ subpopulations of PRRSV-infected PBMCs alone. (D) Sorted CD4+CD25high cells. (E) Percentage suppression at the indicated Tregs: peripheral lymphocyte ratios. The lymphocytes exposed to Marc-145 lysate-treated MoDCs were used as negative control. The percentage of suppression was calculated as follows: % suppression = 100 × [1 − (% proliferation w/PRRSV/ % proliferation w/mock)] [35]. Data from three independent experiments. All data analysis was done using one-way ANOVA and significant differences are shown (*P<0.05 and **P< 0.01).

