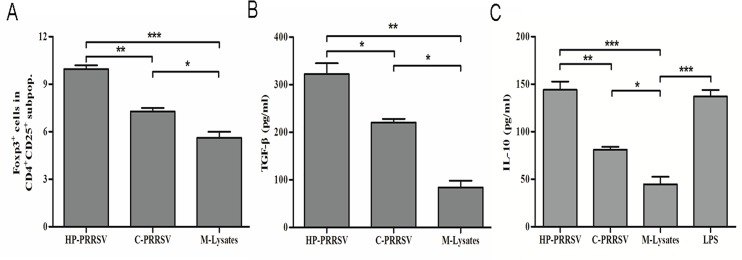
Fig 2. Effects of different PRRSV strains on Tregs induction.

(A) Percentage of Foxp3+ cells in the gated CD4+ CD25+ subpopulations of HP-PRRSV and C-PRRSV. (B) Concentrations of TGF-β in the supernatants of 3-day co-cultures. (C) Concentrations of IL-10 in supernatants of 3-day co-cultures. Data came from three independent experiments. Data analysis was done using one-way ANOVA and significant differences are shown (*P<0.05, **P< 0.01 and ***P<0.001).
