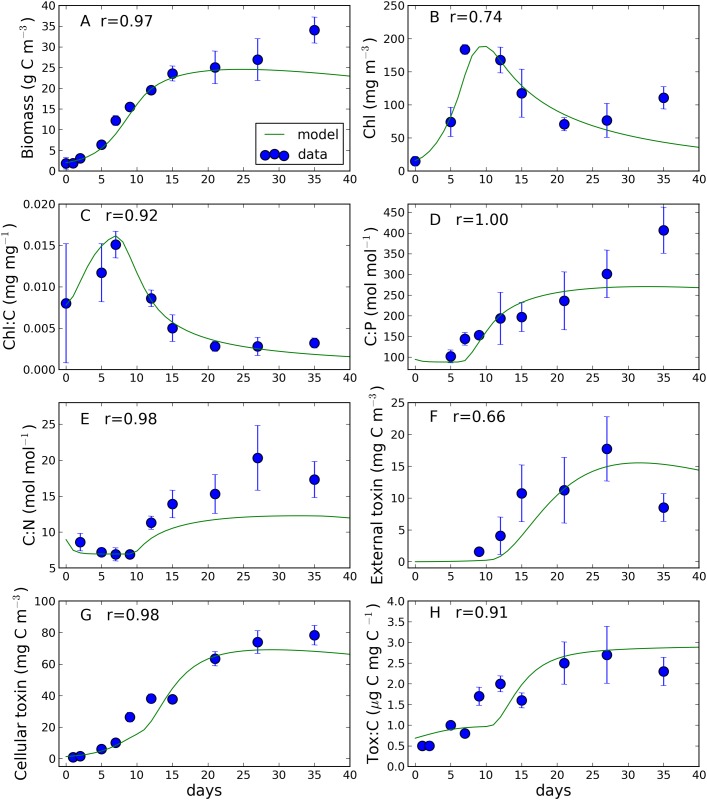
Fig 3. Comparison between observed and simulated (A) algal biomass (Biomass), (B) chlorophyll (Chl), (C) chlorophyll to carbon ratio (Chl:C), (D) carbon to phosphorus ratio (C:P), (E) carbon to nitrogen ratio (C:N), (F) external toxin, (G) cellular toxin and (H) toxin to carbon ratio (Tox:C).
Bars indicate standard deviations. In each panel the Spearman rank correlation coefficient (r) between observations and simulations is also displayed. All the correlations are significant (p<0.05) except for panel F.

