
Fig. 1.
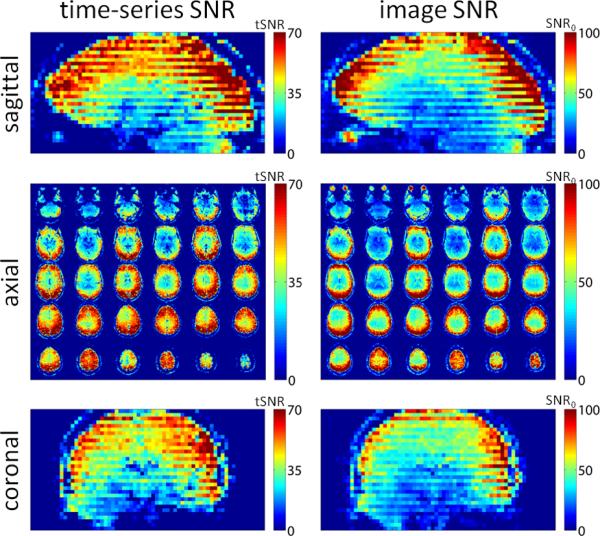
Effects of ACS acquisition on SNR of EPI data. SNR maps of conventional single-shot EPI (3×3×3 mm3, 32-channel RF coil array, BOLD-weighted, 3T) with R=3 acceleration, are shown both in a native axial mosaic as well as coronal and sagittal reformats. The EPI time-series data were reconstructed with GRAPPA using kernels derived from an echo-spacing-matched multi-shot (Ns=3) ACS acquisition. The resulting tSNR and image SNR from the resulting images are shown. Both tSNR and image SNR exhibit SNR discontinuities across slices in the images reconstructed with a kernel derived from multi-shot EPI ACS data.