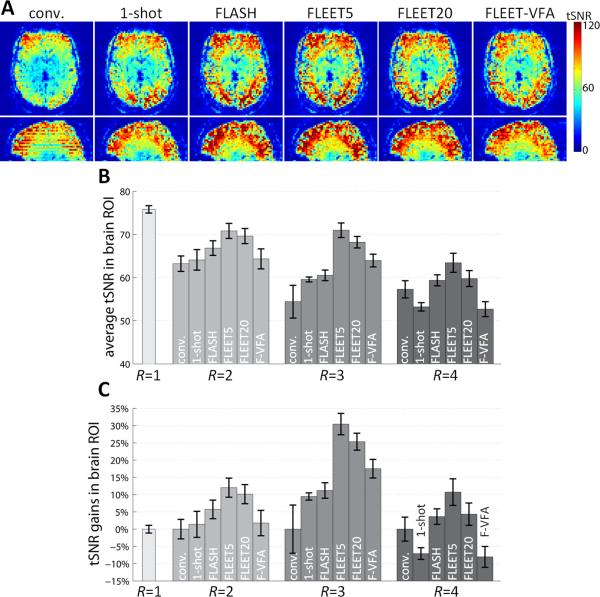
Fig. 4.
Comparison of tSNR between ACS acquisition methods. (A) Example tSNR maps from reconstructions of R=3 accelerated EPI data shown in an axial view and a sagittal reformat. The tSNR exhibits discontinuities across slices in the conventional consecutive-slice ACS data, but the images reconstructed using single-shot ACS data (“1-shot”), FLASH-ACS data, or FLEET5, FLEET20, or FLEET-VFA (“F-VFA”) ACS data exhibit smooth tSNR across slices. (B) A summary of the tSNR comparisons across four 3T subjects, averaged across the brain ROI (including both odd and even slices). While there is some variability across subjects, the FLEET5 appears to yield consistently higher tSNR than the other acquisitions. (Error bars indicate standard error across subjects.) (C) The summary of tSNR shown in (B) replotted and normalized to the tSNR of the conventional consecutive-slice scan for each acceleration factor. tSNR gains up to 30% can be seen in the images reconstructed with FLEET5-ACS data.

