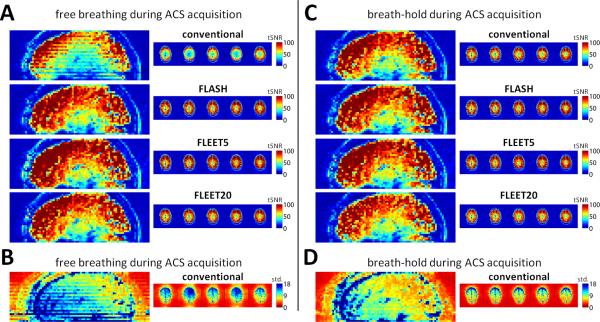
Fig. 7.
Effects of breath-holding during ACS data acquisition. (A) tSNR maps generated from example 3T EPI acquisitions (R=3) reconstructed using ACS data acquired during free breathing. Discontinuous tSNR across slices is seen only in the conventional consecutive-slice acquisition. (B) Corresponding time-series standard deviation map for the images reconstructed with the consecutive-slice acquisition during free-breathing. Discontinuity across slices is clearly seen in the maps, indicating a slice-by-slice variation in the time-series signal instability. (C) tSNR maps from same subject during the same session with identical acquisition protocols but with ACS data acquired during a short breath-hold. The tSNR is unaffected in the images reconstructed with FLEET-ACS and FLASH-ACS data, but the discontinuous tSNR across slices is reduced substantially by the breath-hold in the images acquired consecutive-slice acquisition, suggesting that breathing causes the artifacts in the consecutive-slice acquisition that give rise to the discontinuous tSNR. (D) Corresponding time-series standard deviation map for the images reconstructed with the consecutive-slice acquisition during a breath-hold, showing a smooth progression across slices.

