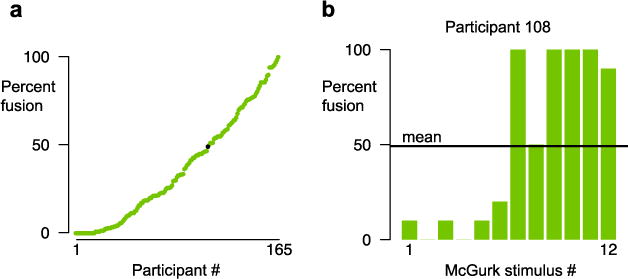
Fig. 1.

Responses to McGurk stimuli during Session 1 of Experiment 1. (a) Mean frequencies of McGurk responses for 165 participants (one symbol per participant, ordered by increasing frequency; data from Exp. 1, Session 1). Fusion responses ranged from 0 % to 100 %. The black symbol shows Participant 108. (b) Frequencies of McGurk responses of Participant 108 to each of the 12 McGurk stimuli. The black line shows the mean frequency across stimuli for this participant; most stimuli are far above or below the mean.
