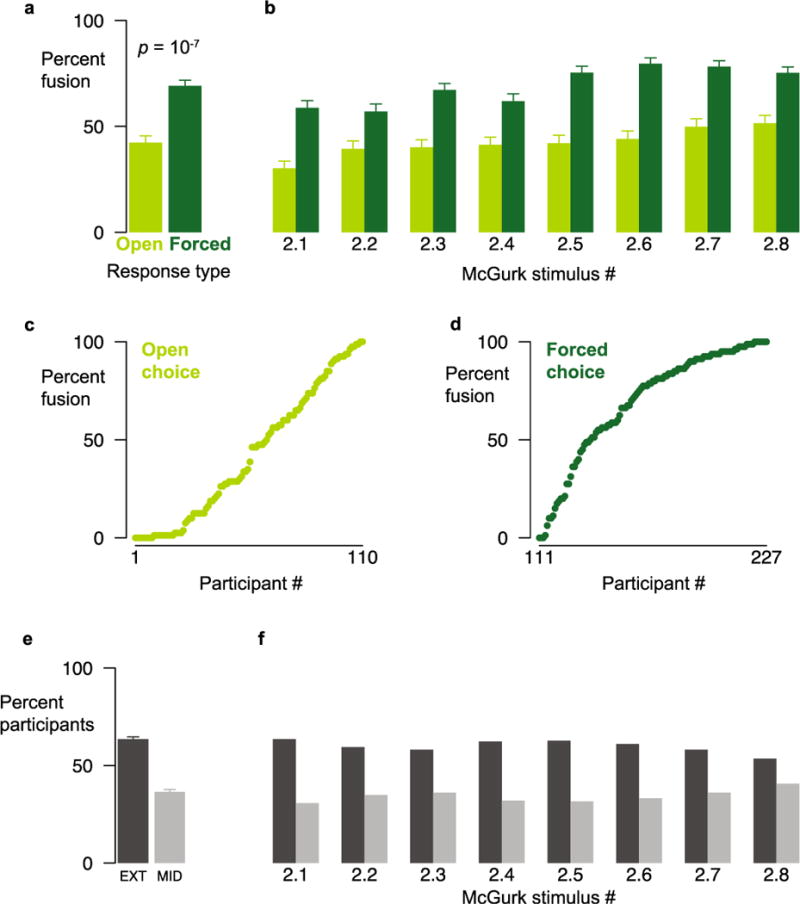
Fig. 4.

Data from Experiment 2, comparing open-choice and forced-choice responding. (a) Percentages of fusion responses averaged across stimuli for open-choice (Open) and three-alternative forced-choice (Forced) responding, tested in two different groups of participants. Error bars indicate SEMs. (b) Percentages of fusion responses for each individual stimulus. (c) Percentage of fusion responses for each individual participant in the open-choice group. (d) Percentage of fusion responses for each individual participant in the forced-choice group. (e) Average percentages of participants across stimuli at the extremes (EXT, dark bar) and in the middle (>10 % and <90 %; MID, light bar) of the distribution. Error bars show SEMs. (f) Percentages of participants in the extremes and in the middle of the distribution for each individual stimulus.
