
Figure 3.
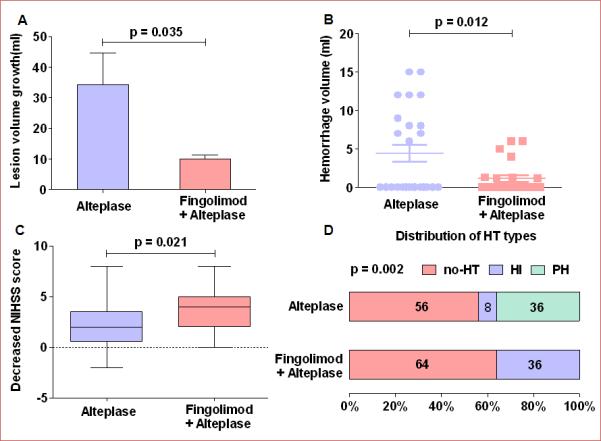
Lesion volume growth, hemorrhage volume and clinical status at day 1. Panel A: Lesion volume growth at day 1; lesion growth = lesion volume measured on Flair (day 1) minus lesion volumes measured on DWI (baseline); values are mean ± SE; comparisons were performed with independent t-tests. Panel B: Hemorrhage volume stemming from hemorrhagic transformation at day 1. Lesion volumes were measured on GRE at day 1; comparisons were performed using the Mann-Whitney test. Panel C: Changes in the NIHSS score at 24 hours. The horizontal line inside each box indicates the median, and the top and bottom of the box indicate the interquartile range. The error bars indicate the 5th and 95th percentiles. Comparisons were performed using the Mann-Whitney test. NIHSS = National Institutes of Health Stroke Scale. Panel D: Distribution of the type of hemorrhagic transformation at day 1; Chi-square test. HT = hemorrhagic transformation, HI = hemorrhagic infarction, PH = parenchymal hematoma, no-HT = no hemorrhagic transformation, Fin = fingolimod.