
Figure 5.
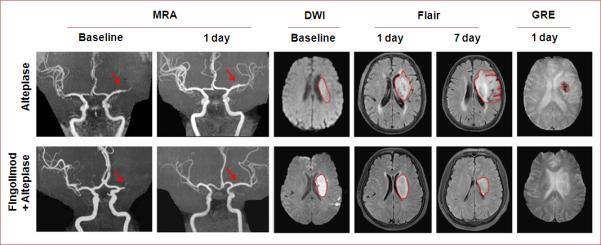
Representative MRI scans of a patient treated with alteplase plus fingolimod and a patient treated with only alteplase. Representative MRI scans show an acute left hemisphere infarct with the complete distal-first segment of middle cerebral artery occlusions in control (upper panel) and an acute left hemisphere infarct with complete mid-first segment of middle cerebral artery occlusions in fingolimod-treated patient (lower panel). At day 1, although the recanalization status of all their vessels was the same, striking differences were evident. The infarct volume was enlarged in the control patient on Flair imaging, and hemorrhagic transformation occurred with hypointense signaling on GRE. In contrast, the progression of infarct volume was restrained in our fingolimod-treated patient. At day 7, lesion volume in the control patients still increased, but to the contrary, lesion volume decreased in the fingolimod-treated patient. Fin = fingolimod.