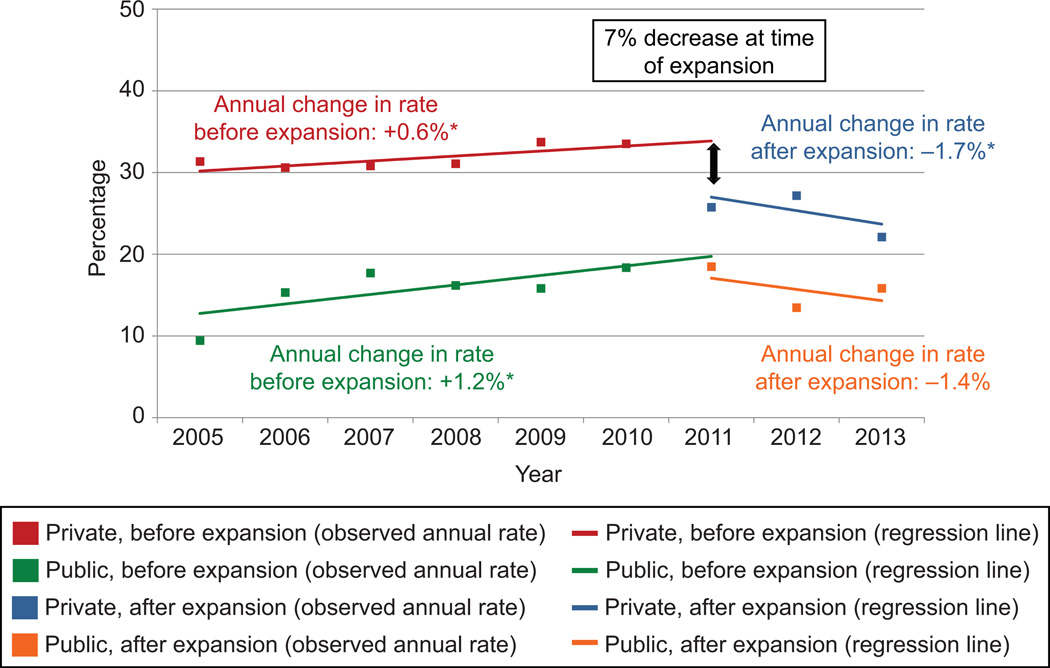
Figure 1.
Nulliparous term singleton vertex primary cesarean delivery rate among privately and publicly insured women before and after expansion of midwifery and laborist services. This graph shows the rates of nulliparous term singleton vertex cesarean delivery plotted over time and the model-predicted rates before and after the practice change as predicted by the interrupted-time series analysis. *The slope is statistically different from zero.

