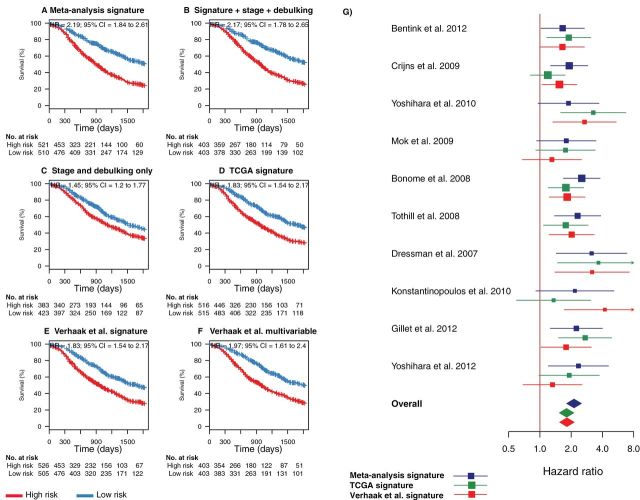
Figure 4.
Combined comparison of our novel meta-analysis gene signature with existing prognostic factors and signatures proposed by The Cancer Genome Atlas (TCGA). This figure provides a summary view of both leave-one-study-out cross-validation and independent validation performance shown in Figures 2 and 3. A) Summary of the risk stratifications in Figures 2 and 3 in a single Kaplan–Meier plot [all studies (Table 1), excluding the TCGA cohort so comparison with the TCGA signatures could be made (6,8,10,13,15,16,28–30)]. This plot compares the survival of all patients classified as high risk in this meta-analysis with all low-risk patients. B) Risk stratification based on a fivefold cross-validated multivariable model using the gene signature risk group (high vs low risk) and the categorical covariables tumor stage (III vs IV) and debulking status (optimal vs suboptimal). The smaller sample sizes arise because of missing clinical annotations. C) Risk stratification based on a fivefold cross-validated multivariable model using tumor stage and debulking status only. D) Summary of risk stratifications by the TCGA gene signature (9) over all cohorts excluding TCGA, as in panel A. E) Summary of risk stratifications by the Verhaak et al. survival signature (18), as in panel A. F) Summary of risk stratifications by the multivariable model proposed by Verhaak et al. using their survival signature, continuous TCGA subtype scores, as well as categorical debulking status and tumor stage. P values were calculated with the log-rank test. G) Forest plot providing an alternative visualization of the hazard ratios (HRs) shown in the Kaplan–Meier plots in Figures 2 and 3 and including a comparison with the corresponding hazard ratios of the TCGA and Verhaak et al. models in all datasets separately. Squares show hazard ratio point estimates, with size corresponding to their weighting in the fixed-effects meta-analysis summaries (inverse of squared standard error); horizontal lines show 95% confidence intervals (CIs); and diamonds at the bottom show fixed-effects summaries of the hazard ratios over all shown datasets. Note that this fixed-effects summary corresponds to the hazard ratios shown in the summary Kaplan–Meier plots in panels A, D, and E. All statistical tests were two-sided.

