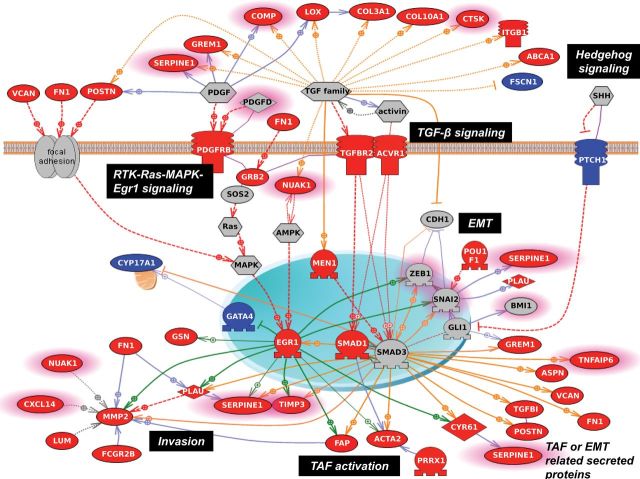
Figure 5.
Pathway analysis of the debulking signature. Using the Pathway Studio 7.1 (Ariadne Genomics) software and a novel signature of 200 debulking-associated genes, we identified pathways statistically significantly associated with suboptimal debulking surgery. A gene is labeled in red when it is overexpressed in tumors that were subsequently suboptimally debulked. Conversely, genes overexpressed in tumors with optimal cytoreduction are labeled in blue. Genes with predictive power toward poor prognosis based on the meta-analysis are highlighted with pink borders. Red broken arrows indicate direct stimulatory modification. Green arrows indicate EGR-1–based transcriptional regulations. Orange arrows indicate TGF-β/Smad–based transcriptional regulations. Blue solid arrows indicate other direct regulations. Blue broken arrows indicate other indirect regulations. Purple sticks indicate binding.

