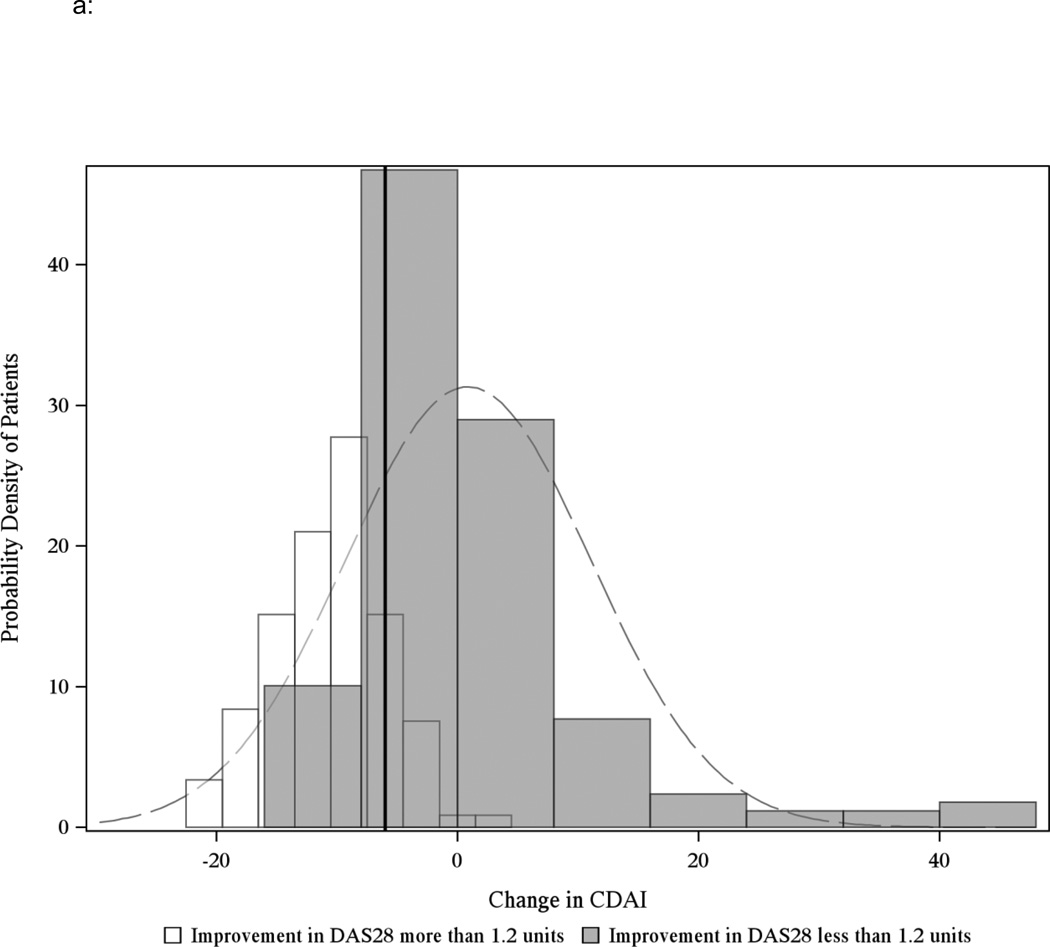
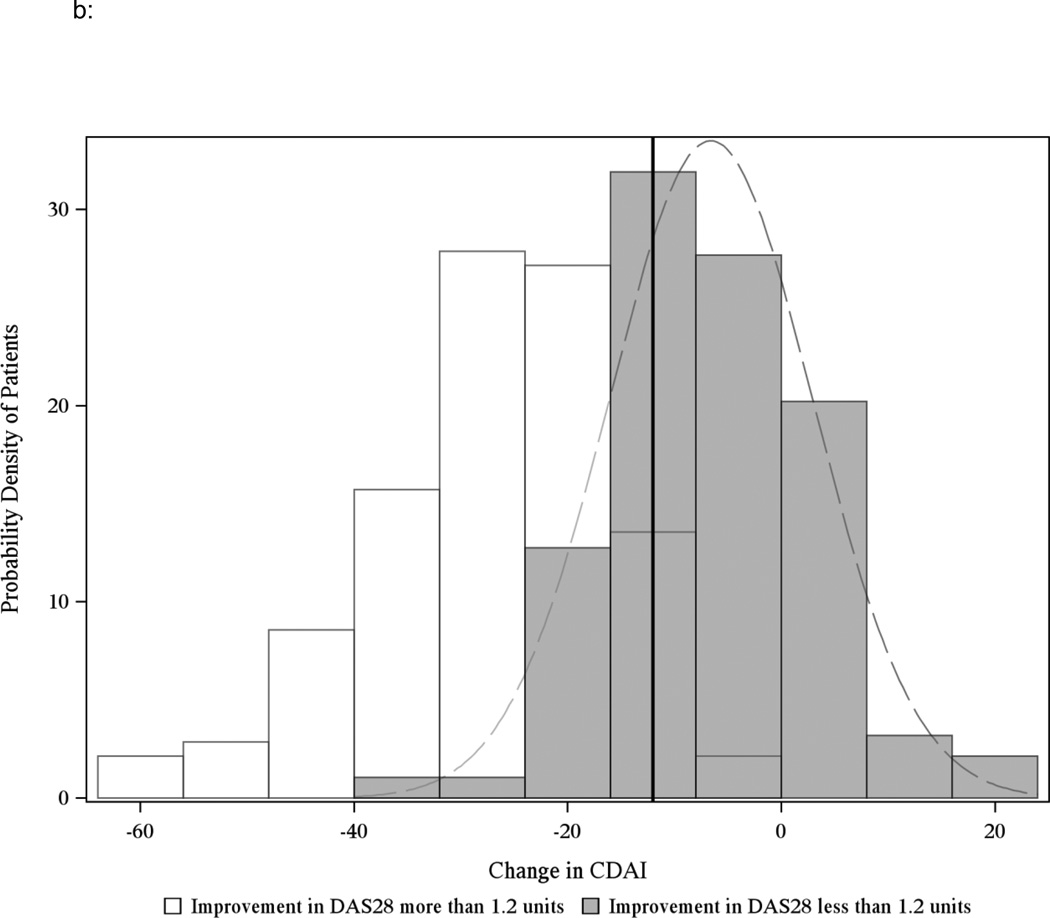
Figure 2.
a: Distribution of the change in CDAI for RA patients starting in moderate disease activity (CDAI between 10 and 22) and corresponding change in the DAS28ESR of 1.2 units (n=212 unique CATCH patients, 288 visit pairs after excluding observations with missing DAS28ESR)
The solid black line indicates the threshold value for MCID −6 unit and includes patients who start in moderate disease activity. Light grey bars indicate overlap between the black and white curves. AUROC = 0.82.
b: Distribution of the change in CDAI in starting in high disease activity (CDAI greater than 22) and corresponding change in the DAS28ESR of 1.2 units (n=200 unique CATCH patients w/ 234 pairs after excluding observations with missing DAS28ESR)
The solid black line indicates the threshold value for MCID −12 units and includes patients who start in high disease activity. Grey bars indicate overlap between the black and white curves. AUROC = 0.83.


