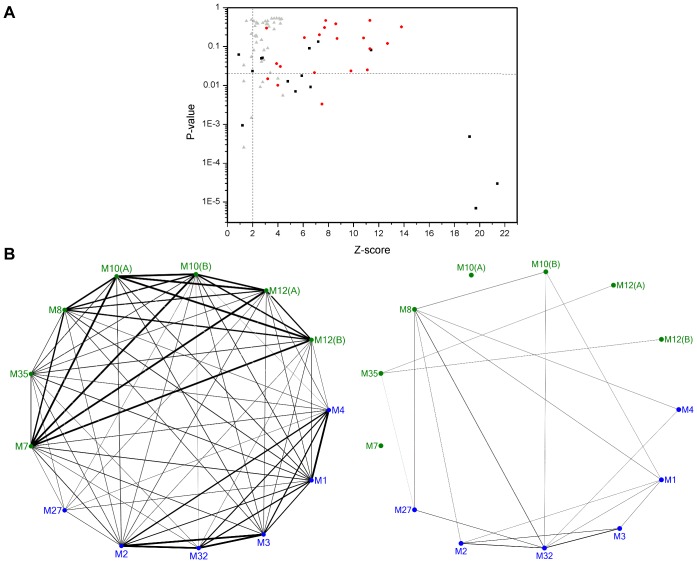
Fig 3. Dynamical and structural variability of MA clan representative structures.
(A) Mapping of structural (Z-score) and dynamical (P-values) alignment scores obtained for the pairs of MP structures. Red circles: Metzincin pairs; Black squares: Gluzincin pairs; Gray triangles: Mixed pairs. Dashed lines indicate threshold values for structural (vertical) and dynamical (horizontal) similarity. Labeled pairs were selected for further inspection. (B) Graph representation of the structural (left) and dynamical (right) similarity between MP representatives (Blue: Gluzincins; Green: Metzincins). Edge width is proportional to the corresponding Z-score and P-value and only edges with width values above the corresponding thresholds are represented.

