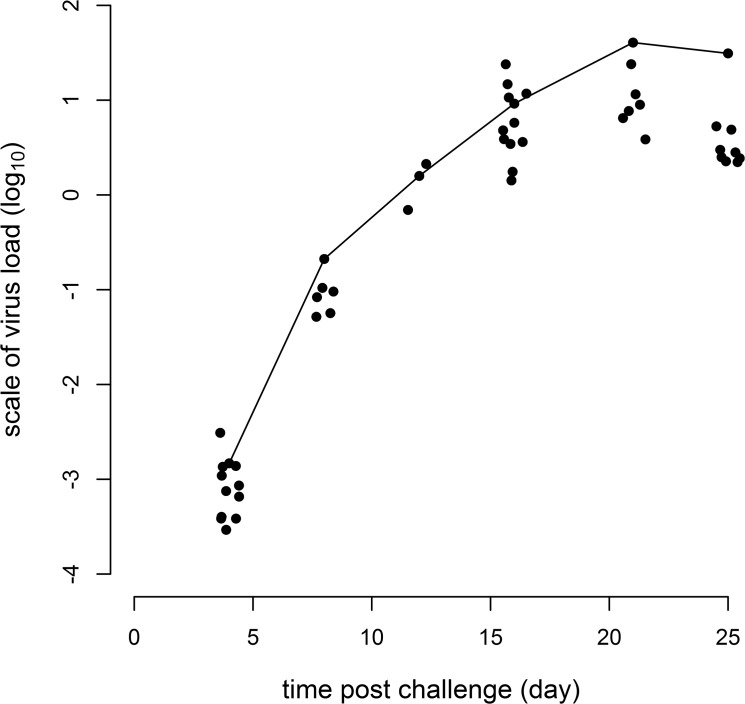
Fig 2. Log10 ISAV load for challenged experimental group individuals over the course of the experiment.
The solid line (—) is included as an aid to follow the response of the individual with the highest value. Values around the fixed time points of 4, 8, 12, 16, 21 & 25 days have been horizontally jittered to improve visualisation.

