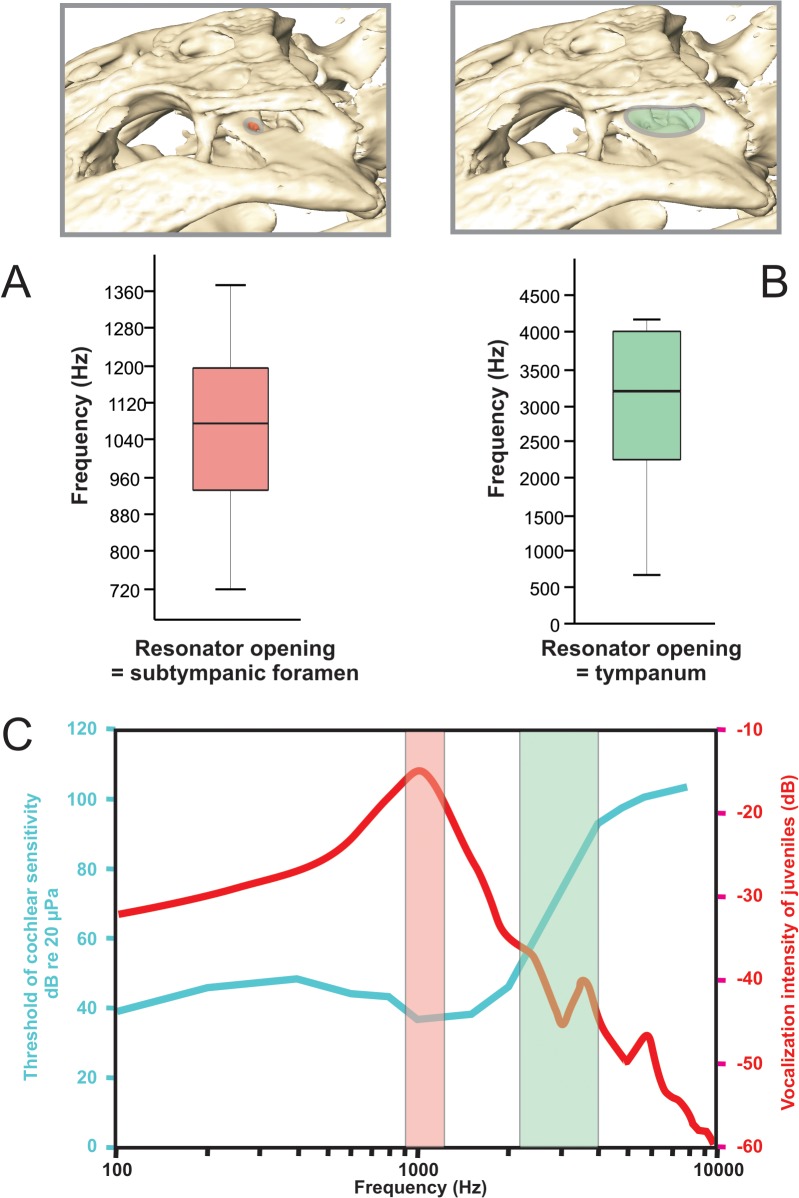
Fig 15.
Schematic showing calculated resonant frequencies for A) subtympanic foramen (pink oval) as candidate resonator opening along with plot showing calculated resonant frequencies for an ontogenetic series of alligators. B) tympanic membrane (green oval) as candidate resonator opening along with plot showing calculated resonant frequencies for an ontogenetic series of Alligator. C) Graph adapted from Higgs et al. (2008), showing frequencies of greatest cochlear sensitivity (blue) and juvenile vocalization intensity (red) with the results of the auditory performance analysis superimposed as pink and green bars. Superimposed resonance frequencies show correlation between resonance with the subtympanic foramen to greatest cochlear sensitivity and juvenile vocalization frequencies.

