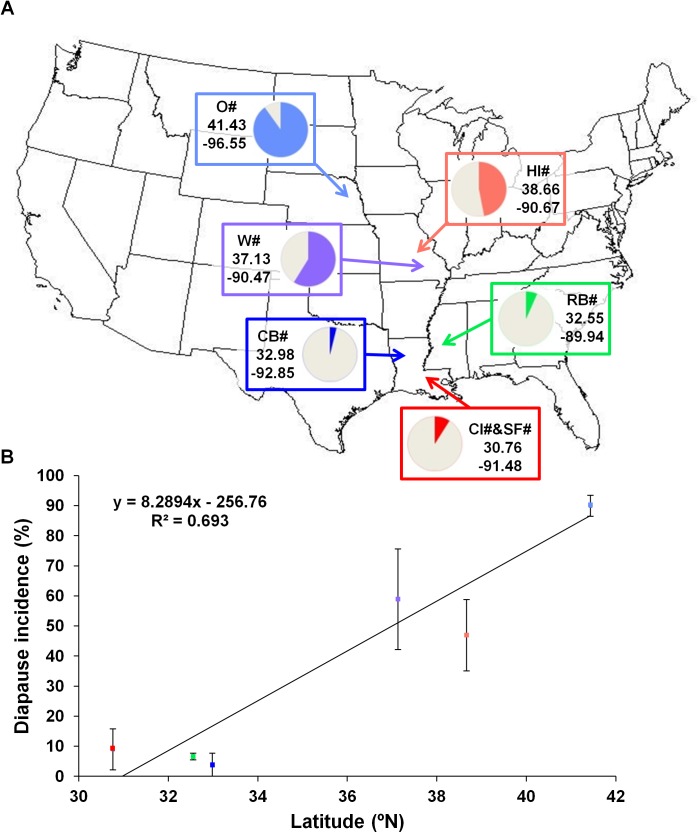
Fig 2. Geographical origin and diapause incidence of different populations of D. americana across the USA.
Diapause frequencies are represented by the color portion of the circular graphics close to the geographical coordinates and collection sites (O–Fremont, Nebraska, HI–Howell Island, Missouri; W–Lake Wappapelo, Missouri; RB–Pearl River, Mississippi; CB–Corney Bayou, Louisiana; and CI&SF–Cat Island, Saint Francisville, Louisiana) of the strains phenotyped (A). Diapause frequencies of each strain were used for the linear regression with the latitude of origin, and are presented by the average ± standard error of the mean (S.E.M) for each population. The slope of the curve represents the increase on diapause incidence with latitude and the R2 value, the amount of variation on this phenotype explained by latitude (69.3%) (B).

