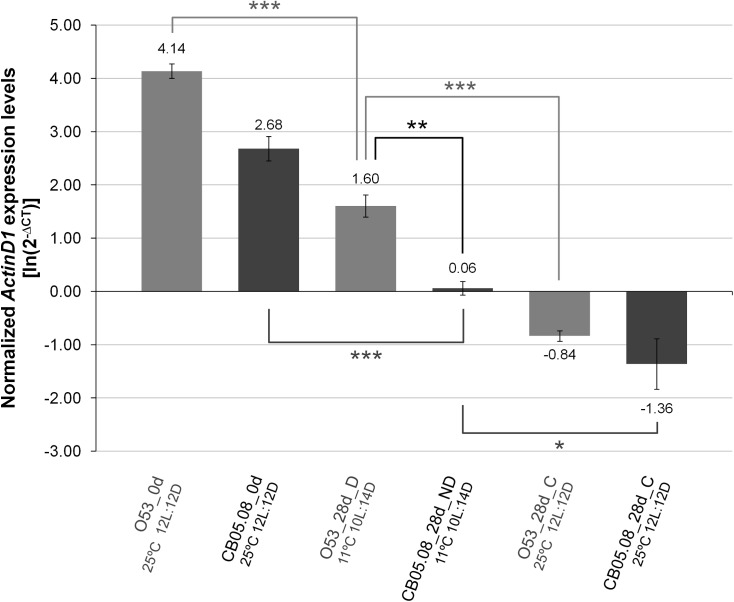
Fig 4. ActinD1 expression levels drop slowly under diapause inducing conditions.
Differences in ActinD1 gene expression levels were addressed between new born females (0d), diapausing (D) and non-diapausing (ND) 28 days old females reared under diapause inducing conditions (10L:14D at 11°C) and controls (C) reared for 28 days under non-diapause inducing conditions (12L:12D at 25°C). The reference gene RpL32 was used to normalize the expression values. Three biological replicates were used for each sample and the averages of the log-transformed values of 2-∆CT are presented with their respective S.E.M. A two-tailed Student’s t test assuming equal variances was used to address if the averages of normalized ActinD1 expression levels of the different samples and treatments are significantly different (* 0.05 > P > 0.01; ** 0.01 > P > 0.001; *** P < 0.001).

