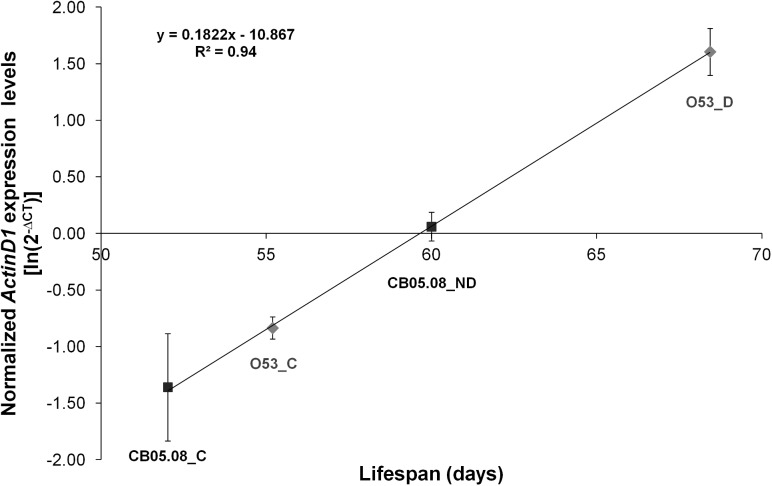
Fig 5. ActinD1 expression levels are highly correlated with LS expectancy.
Fold changes in ActinD1 expression levels obtained for 28 days old controls (O53-C and CB05.08-C), as well as for 28 days old diapausing (O53-D) and non-diapausing females (CB05.08-ND) were plotted against their respective LS values obtained under 12L:12D at 25°C (excluding the first 28 days). Three biological replicates were used for each sample, and the individual log-transformed expression values were used for the linear regression. The averages of the log-transformed values of 2-∆CT are presented with their respective S.E.M.. The slope of the curve represents the increase in ActinD1 expression levels with increased LS expectancy, and the R2 value the amount of variation in expression levels explained by LS (94%).

