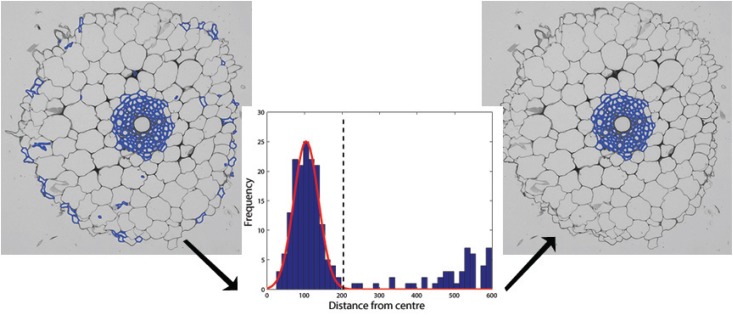
Fig 6. Finding the central metaxylem.
Left: Collection of all small cells. Middle: Histogram showing the distance from the centre of each cell to the centre of the root vs frequency. The peak at low distances corresponds to cells inside the stele and endodermis. Right: Keeping cells whose distance is greater than the illustrated threshold provides a first estimate of stele and endodermis cells.

