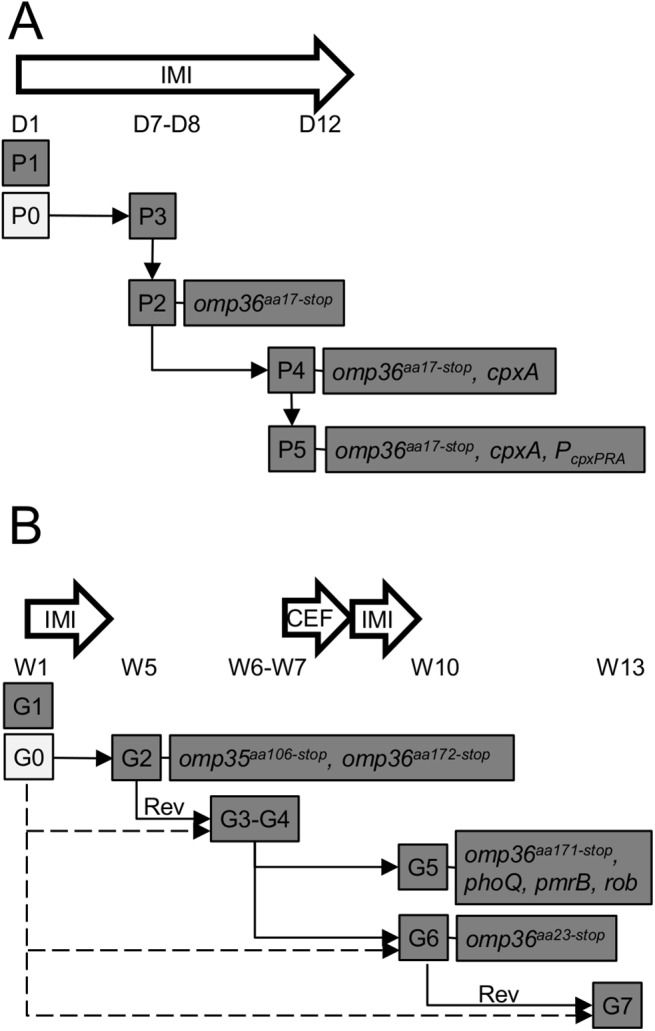
Fig 5. Model of intra-patient evolution of E. aerogenes during antibiotic treatment.

Plain arrows represent the putative evolution of bacterial subpopulations in patient P (A) and patient G (B). The genomic distance between the first isolates (P1 and G1) and the subsequent strains (P2-P5 and G2-G7) indicates that these have evolved from other ancestors (P0 and G0). Lack of evidence of genotypic reversion (Rev) from resistant to susceptible strains within the G series suggest alternative evolutionary pathways represented by dotted arrows. Clinical timelines are indicated from day (D) 1 to D12 and week (W) 1 to W13 for patient P and patient G, respectively. IMI, imipenem; CEF, cefpirome.
