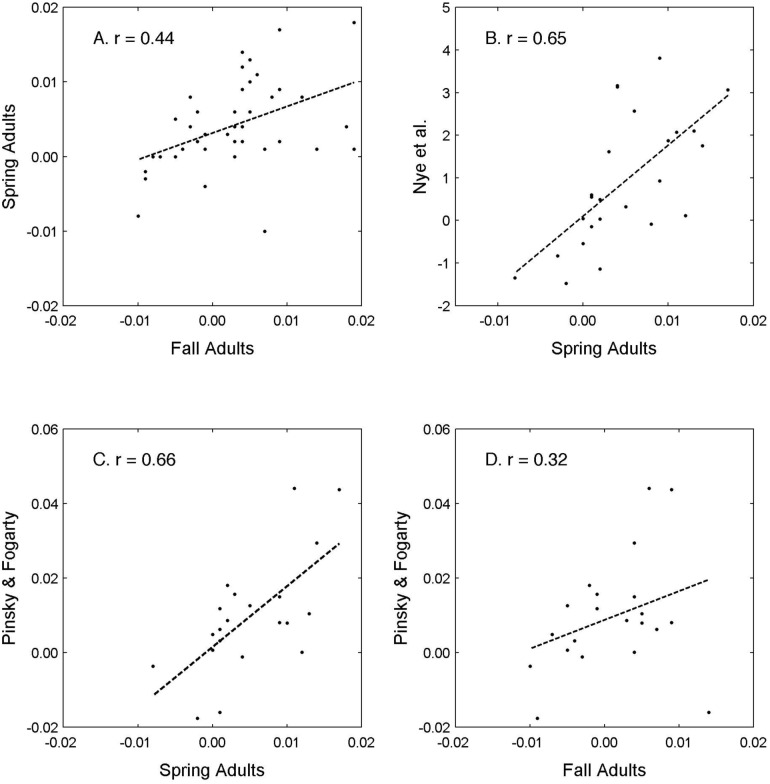
Fig 12. Correlation results among methods used to examine change in distribution of adult fish in the Northeast U.S. Shelf Ecosystem.
Methods used to examine change in along-shelf distribution of mature adult fishes were correlated for spring to fall as measured in this study (A), spring from this study to Nye et al. [4] (B), spring from this study to Pinsky and Fogarty [49] (C), and fall from this study to Pinsky and Fogarty [49] (D). Our analyses produced a linear slope based on a spatially explicit change statistic. Nye et al. [4] calculated a linear slope from the annual change in the center of biomass in an along-shelf direction for the spring survey. Pinsky and Fogarty [49] calculated a linear slope for the annual change in the center of biomass in a north-south direction averaged across the spring and fall surveys.

