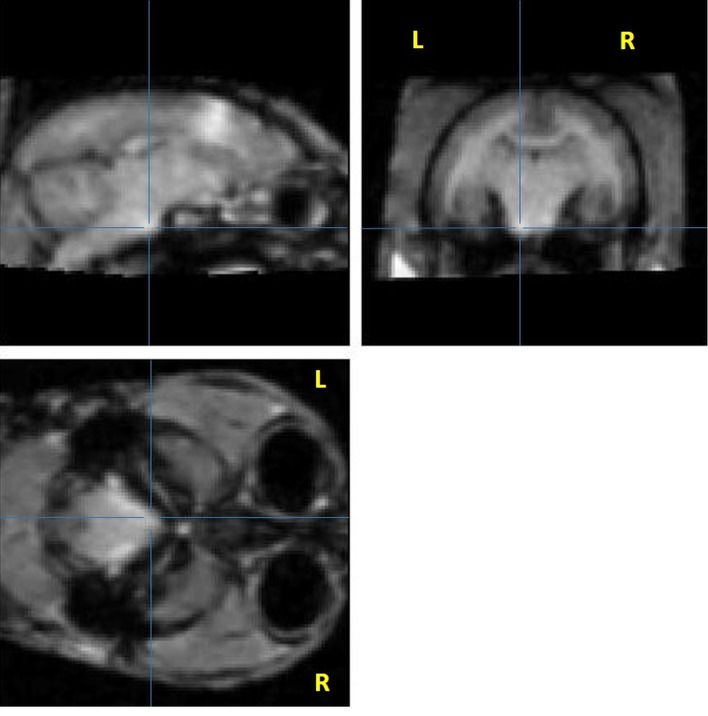
Fig 4. Single marmoset’s raw image showing manganese-induced hyperintensity in the pyramids.
Sagittal, coronal, and axial slices showing manganese-induced hyperintensity in the pyramids. Note the hyperintensity compared to the contralateral side. Raw images of the marmoset with MnCl2 signal reaching the pyramid with an 8 nmol injection. Three views at coordinates 1,25mm lateral; -0.2 mm AP from bregma; +3 mm dorsoventral from the interaural line. Lines show MnCl2 signal in the pyramid at the brainstem level.

