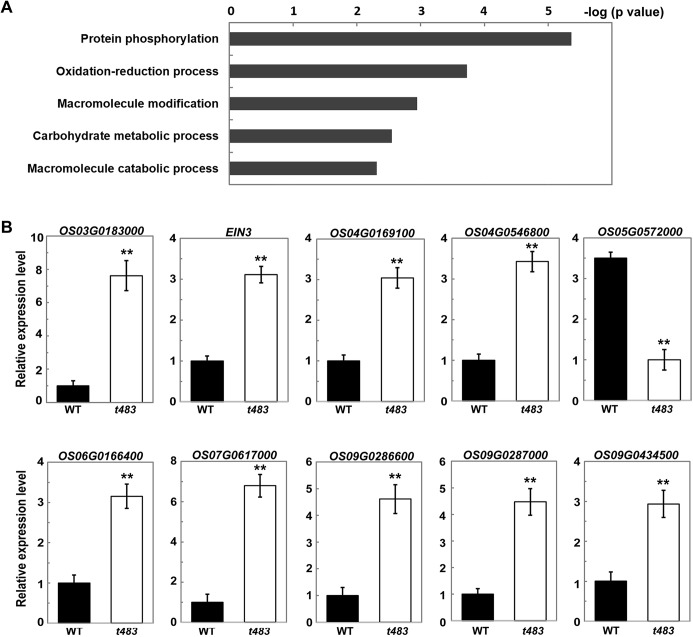
Fig 5. Analysis of differentially expressed genes in young t483 seedlings.
A, Identification of GO biological process categories for genes differentially expressed in t483. Negative logarithms (base 10) of the adjusted P values were used as the bar lengths. B, qRT-PCR analysis of expression in ethylene signaling-related genes. Values are means ±SD of three replicates. Student's t-test was used to determine significant differences in expression (**P<0.01).

