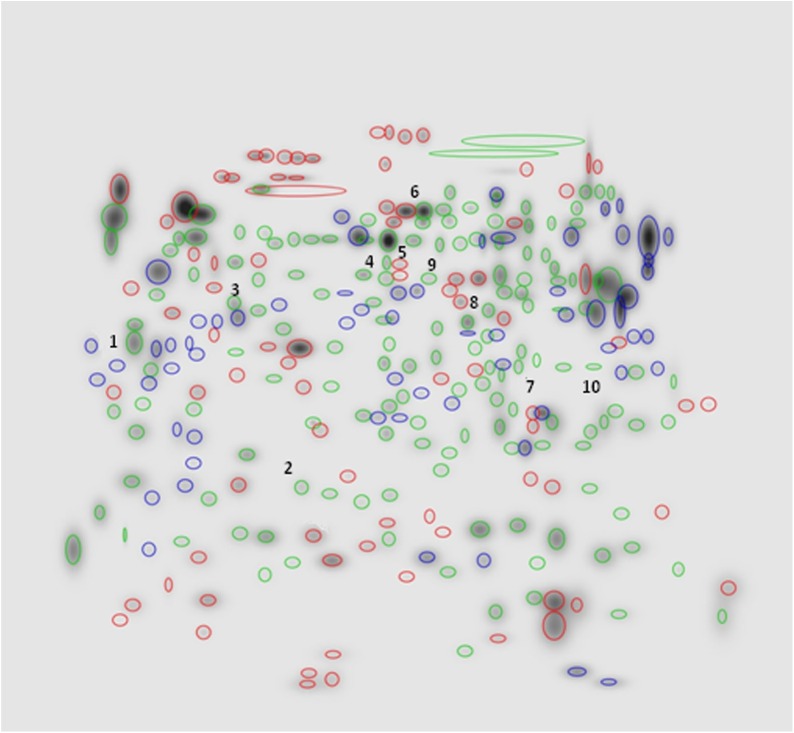
Fig 2. High Master gel, showing qualitative differences between the SG and OT 2-DE master gel patterns (NL, pH 3–10 gradient range).
Labelled in green: spots (n = 170 ± 25) common to both SG and OT. Labelled in red: spots (n = 81) exclusive of SG. Labelled in blue: spots (n = 57) detected solely in OT.

