
Fig 4. Comparison of expression profiles for those with and without FLT3/ITD mutation.
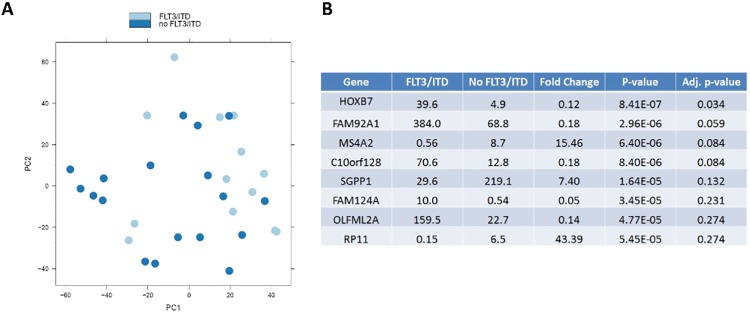
(A) PCA for the two groups. (B) Genes with the most significant adjust p-value between the two groups.
Official websites use .gov
A
.gov website belongs to an official
government organization in the United States.
Secure .gov websites use HTTPS
A lock (
) or https:// means you've safely
connected to the .gov website. Share sensitive
information only on official, secure websites.
(A) PCA for the two groups. (B) Genes with the most significant adjust p-value between the two groups.