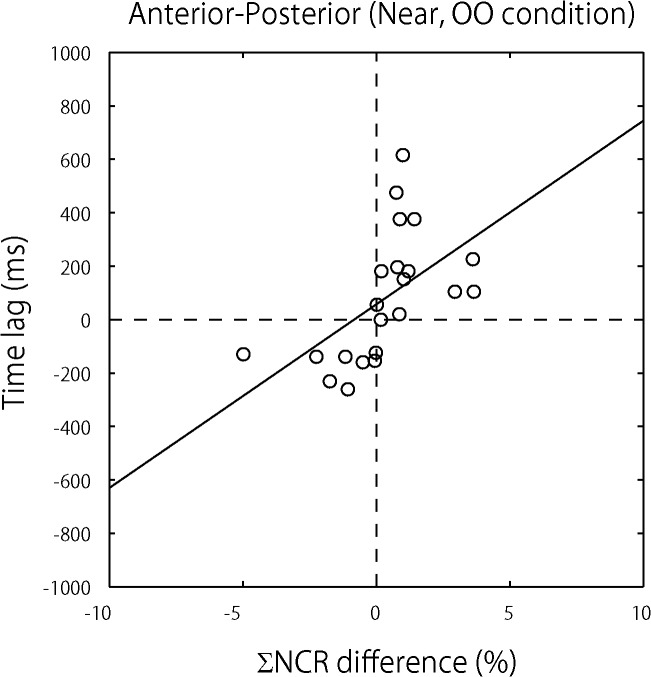
Fig 5. Relation between participants’ influence and time lag for postural sway synchronization.
Each dot in the figure represents the average of all trials for each of the paired participants. The data are plotted in the following way. X-axis values represent differences in paired participants’ influence on one another’s postural sway (estimated by ΣNCR difference (%)), and y-axis values represent the time lag (ms) that occurred when postural sway was synchronized. These data come from the Open-Open condition (see Fig 1 for the test conditions) and account for postural sway along an anterior-posterior axis only. As the figure shows, when the time lag is closer to 0, the ΣNCR difference (%) is closer to 0, i.e., the level of influence that paired participants exerted on one another was close to the same. This observation was supported by the regression analysis between the two factors (see the regression line included in the figure).

