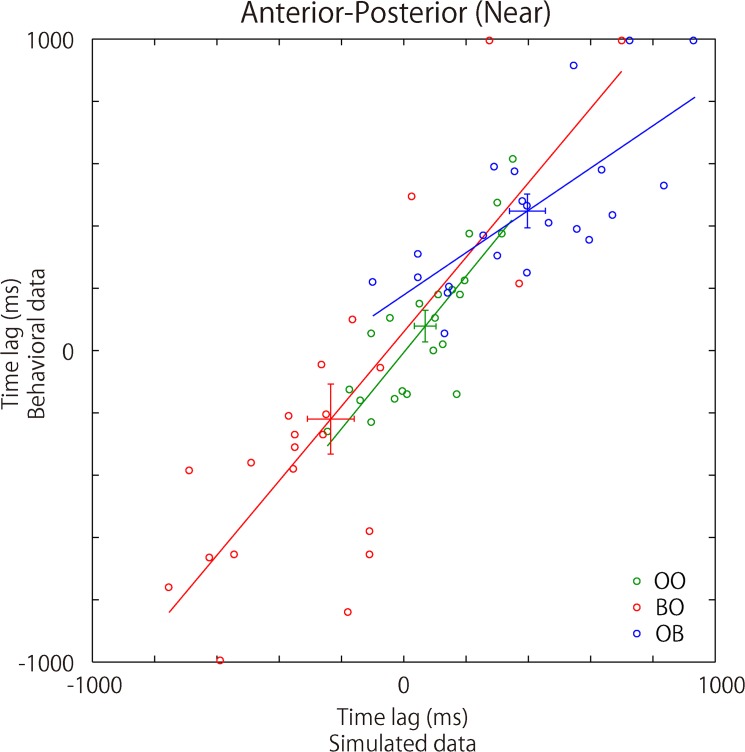
Fig 6. Simulated results for time lag in synchronization.
The figure illustrates the relationship between the synchronization time lag for the simulated and the behavioral data (for the simulation procedures, see Fig 2). The colored dots, green, red, and blue, in the figure correspond to the results for the Open-Open, Blindfold-Open, and Open-Blindfold conditions, respectively. The same color was used for the regression line for each of the conditions. The slope for each regression line was significantly higher than 0, suggesting a positive relation between the simulated and behavioral data.

