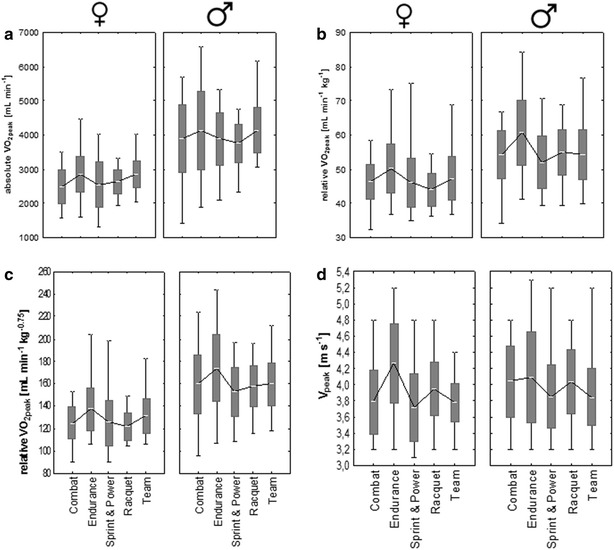
Fig. 2.

Overview of all mean ± SD and range data for all variables classified by discipline for both gender for a absolute oxygen uptake (ml min−1), b relative oxygen uptake (ml min−1 kg−1), c relative oxygen uptake (ml min−1 kg−0.75), d vpeak (m s−1). The bars are indicating standard deviation, the whiskers are indicating min and max values. Asterisk indicating significant differences between disciplines
