. 2015 Apr 22;45(5):398–407. doi: 10.4070/kcj.2015.45.5.398

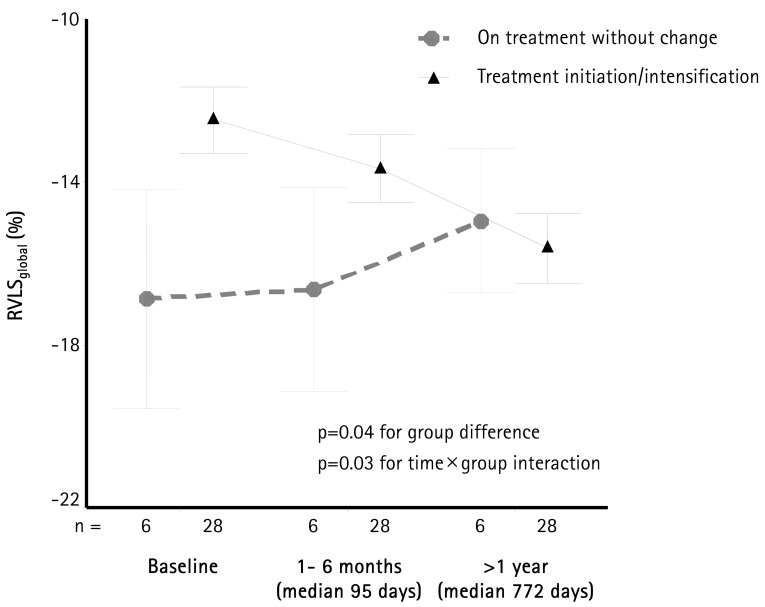
Fig. 5. RVLSglobal during follow up. Data are presented at baseline, within the first 6 months, and after more than a year after initial echocardiogram. Patients were separated into the group already on treatment for pulmonary hypertension (n=6), and a group of in whom treatment was initiated or in intensified (n=28) after the baseline echocardiogram. Patients who were already on treatment had better RVLSglobal (p=0.04) during the study period. However, patients in whom treatment was initiated or intensified showed significant improvement in RVLSglobal during follow up (p=0.03). Error bars show 1 standard deviation. RVLSglobal: right ventricular global longitudinal strain of right ventricle.

Fig. 5