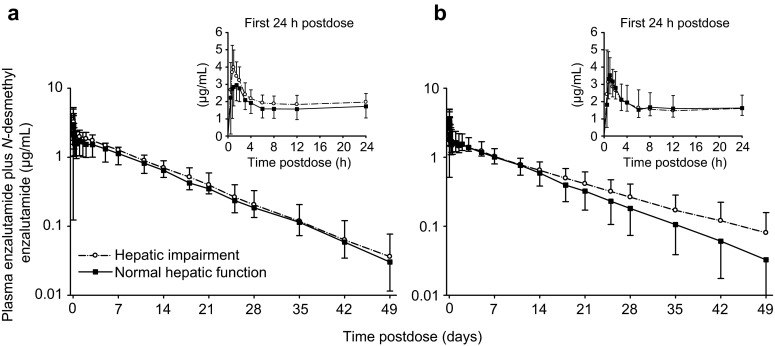
Fig. 5.

Concentration–time profiles (mean ± standard deviation) for the sum of enzalutamide plus N-desmethyl enzalutamide after a single oral dose of enzalutamide 160 mg in male subjects: a subjects with mild hepatic impairment (Child–Pugh Class A; n = 8) and the age- and BMI-matched control subjects with normal hepatic function (n = 8); b subjects with moderate hepatic impairment (Child–Pugh Class B; n = 6) and the age- and BMI-matched control subjects with normal hepatic function (n = 6). BMI body mass index
