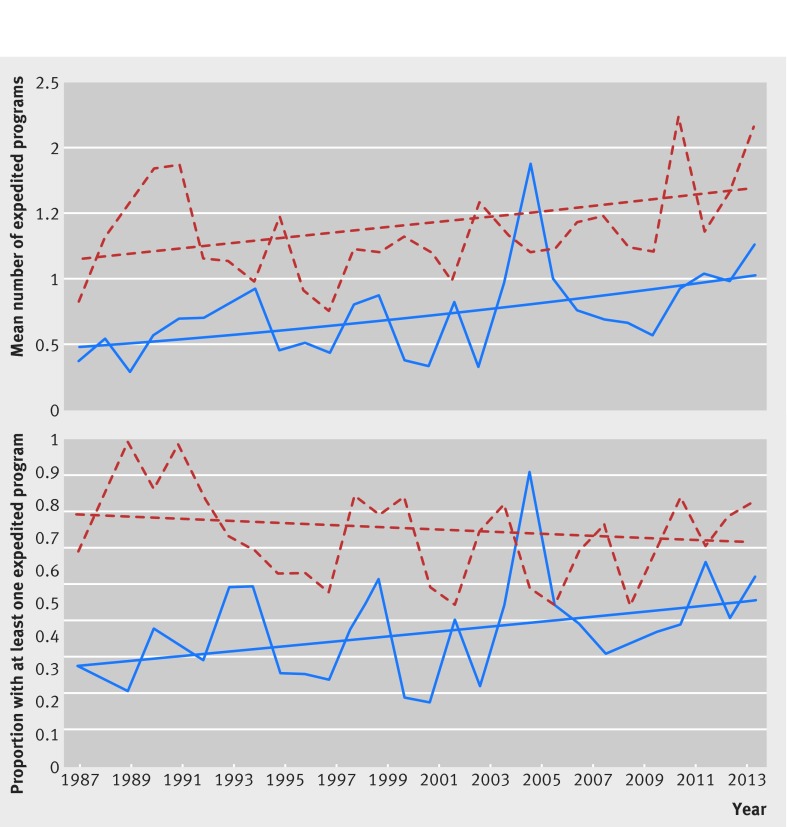
Fig 3 Time trend analyses comparing all expedited programs associated with first in class and follow-on therapeutics approved by US Food and Drug Administration, 1987-2014. Top: mean number of expedited development and FDA review programs (orphan, accelerated approval, fast track, and priority review) granted to each newly approved first in class (red dotted line) and non-first in class (blue solid line) prescription drug from 1987-2014. Drugs can be associated with more than one program. Bottom: proportion of newly approved first in class (red dotted line) and non-first in class (blue solid line) prescription drugs from 1987-2014 that were granted at least one of the four programs

An official website of the United States government
Here's how you know
Official websites use .gov
A
.gov website belongs to an official
government organization in the United States.
Secure .gov websites use HTTPS
A lock (
) or https:// means you've safely
connected to the .gov website. Share sensitive
information only on official, secure websites.
