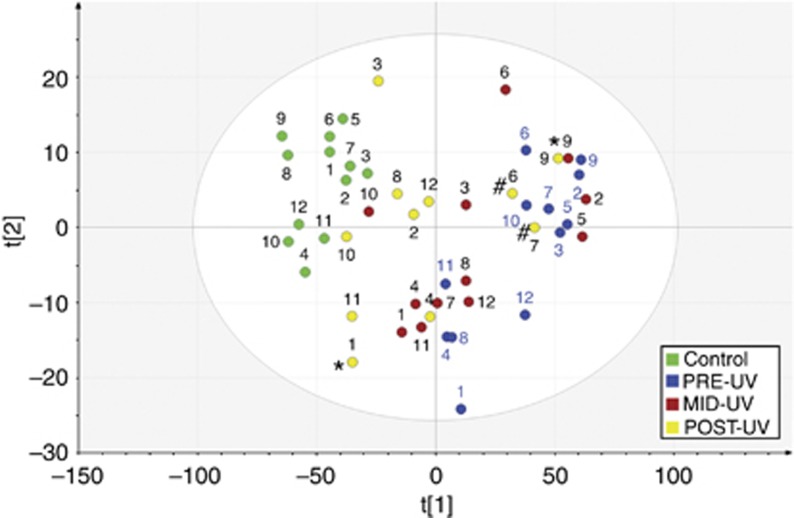
Figure 3.
Score plot from PCA analysis for 12 psoriasis patients undergoing phototherapy and 12 corresponding controls. PCA score plot of the two first PCs of the methylation data set providing a map of how the samples relate to each other. The samples are colored by the sample group. Assessment of clinical response was given in three grades: Excellent, good, or unsatisfactory. POST-UV samples from patients with good or unsatisfactory response to phototherapy are indicated with symbol * or #, respectively.

