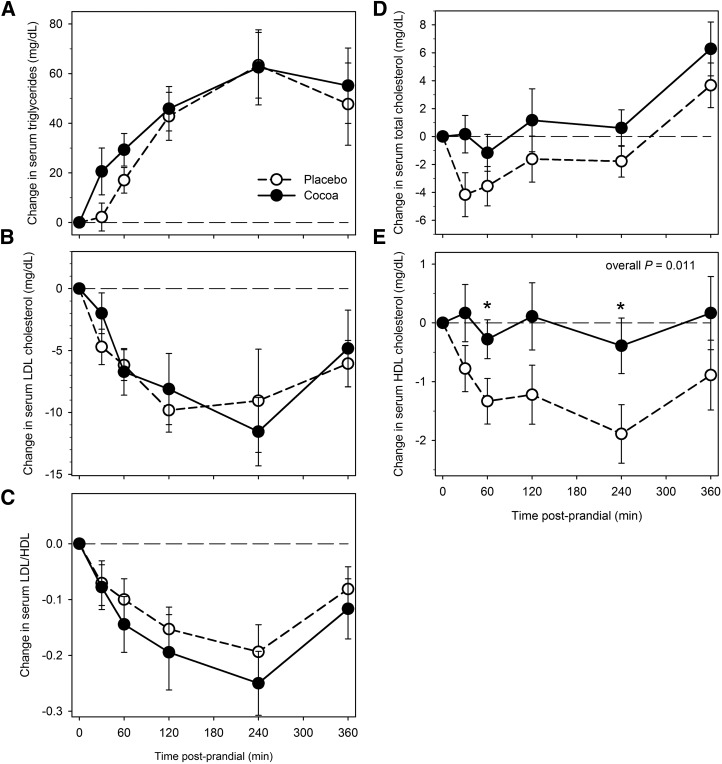
FIGURE 2.
Changes from baseline (fasting) in serum TGs (A), LDL cholesterol (B), LDL:HDL cholesterol ratio (C), total cholesterol (D), and HDL cholesterol (E) after cocoa vs. placebo intervention with a high-fat meal in obese participants with type 2 diabetes. Data are means ± SEMs, n = 18. *Different from placebo, P < 0.05. Overall P, derived from general estimating equation, is for difference between change after cocoa vs. placebo intervention across the entire 6-h period, accounting for the variation at each time point.

