Figure 6.
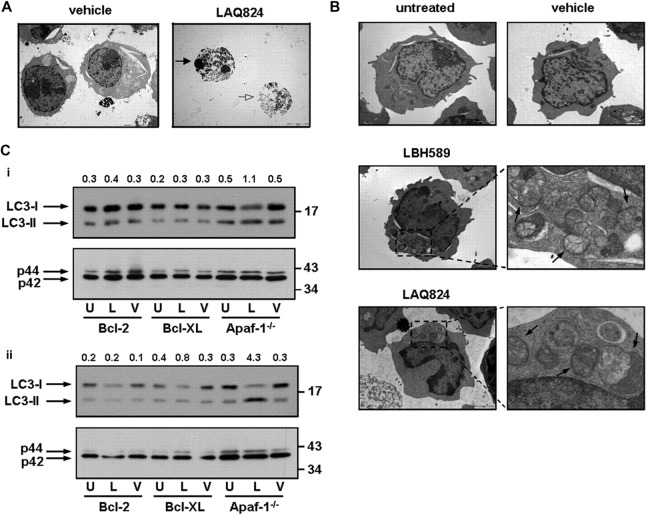
HDACi induce morphologic and biochemical changes associated with autophagy. (A) Eμ-myc lymphoma cells were treated for 24 hours with vehicle or LAQ824 (25 nM) and assessed by TEM.  indicates an apoptotic shrunken cell with condensed nuclei;
  , a cell with a disrupted outer cell membrane. (B) Eμ-myc/apaf-1−/− lymphomas were left untreated or treated for 24 hours with vehicle, LAQ824 (25 nM), or LBH589 (4 nM) and assessed by TEM. Treatment of Eμ-myc/apaf-1−/− lymphoma cells with LAQ824 or LBH589 for 24 hours resulted in the formation of autophagic vacuoles. Higher magnification shows autophagic vacuoles (
 ) containing a double membrane. Scale bars represent 5 μm. (C) Eμ-myc/bcl-2, Eμ-myc/bcl-XL, and Eμ-myc/apaf-1−/− lymphomas were left untreated (U) or treated with (i) 4 nM LBH589 (L) or vehicle (V) or (ii) 25 nM LAQ824 (L) or vehicle (V) for 24 hours and analyzed for endogenous LC3 by Western blot (top panels).
  indicate positions of LC3-I and LC3-II. The ratio of LC3-II to LC3-I was assessed by densitometry and is displayed above each lane. Membranes were stripped and reprobed for p42 as loading control (bottom panels).

