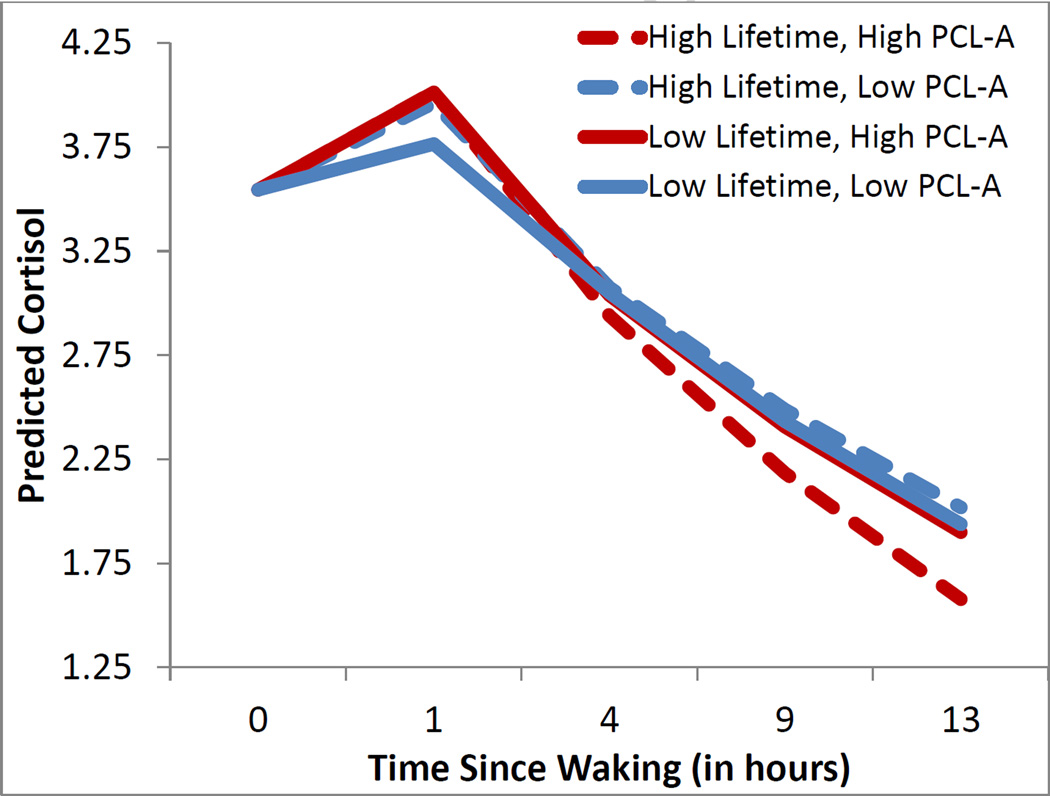
Figure 2.
Boys with high Lifetime stress exposure on the LSI (+1SD, dashed lines) as opposed to low lifetime stress (−1SD, solid lines) are illustrated as well as boys with high PCL:YV Affective scores (+1SD, red lines) as opposed to low PCL:YV Affective scores (−1SD, blue lines). Boys with higher PCL scores had a steep cortisol awakening response (red lines); boys with both elevated PCL and LSI scores (dashed red lines) displayed steep diurnal slopes. Lines represent predicted scores using Empirical Bayes Estimates within HLM for continuous scores one standard deviation from the mean.

