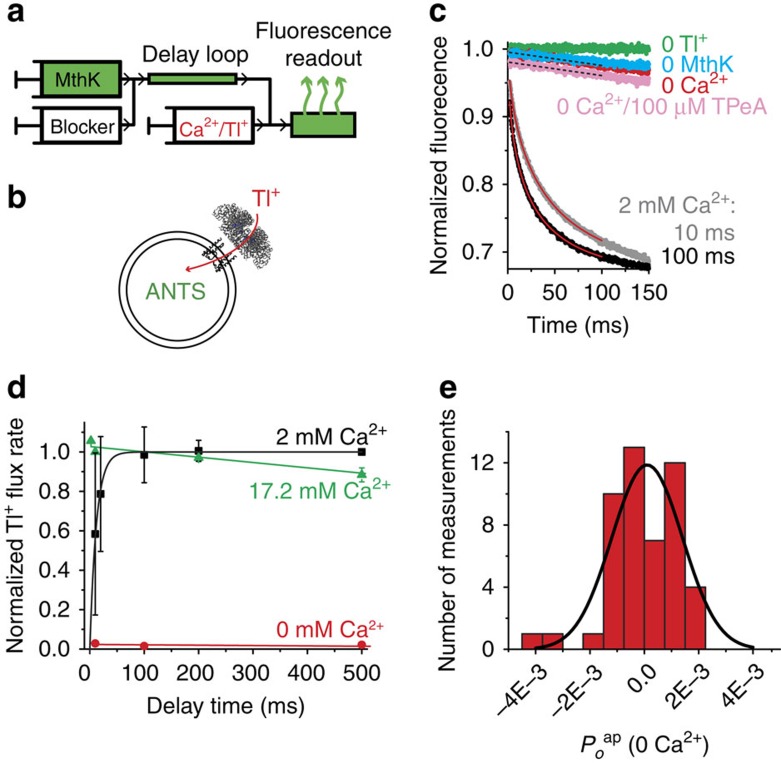
Figure 2. MthK is closed in 0 Ca2+ and is activated quickly with Ca2+.
(a) Schematic representation of the sequential-mixing stopped-flow device. The mixing sequence for a closed-state block assay is shown from left to right (Supplementary Fig. 1). MthK-reconstituted liposomes are mixed with blocker and incubated in a delay loop for a defined time interval followed by mixing with activating Ca2+ and fluorescence-quenching Tl+ into an optical cell for fluorescence readout. (b) Open MthK channels allow Tl+ entry (red arrow) into the liposomes, quenching the fluorescence of the encapsulated ANTS dye. (c) Fluorescence quench curves for MthK liposomes after 10 or 100 ms (grey and black, respectively) incubation with 2 mM Ca2+. Flux rates were from fits to stretched exponentials (red lines). Control fluorescence is in the absence of Tl+ (green). A small leak of Tl+ into liposomes is observed in experiments without Ca2+ (red), similar to the leak in MthK-free liposomes (cyan). The non-specific Tl+ leak in MthK liposomes was also measured in the presence of 100 μM TPeA (pink). A linear fit was used to analyse the slow Tl+ leak signals (black dotted lines). (d) Relative Tl+ flux rates as a function of Ca2+ incubation time for 0 (red), 2 (black) and 17.2 mM (green) Ca2+. Symbols are the mean±s.d. from three (or two for 0 mM Ca2+)-independent measurements. (e) Histogram of 49 independent estimates of apparent open probability in the absence of Ca2+ (Poap(0 Ca2+), calculated using equations (4, 5, 6, 7, 8) in the Methods section). The average value was −0.00004±0.0002 (mean±s.e.m.). The histogram was fit with a Gaussian distribution (black line) with mean at Poap(0 Ca2+)=0.0001±0.0003 (0.01±0.03%) and s.d. σ=0.0013±0.0003.

