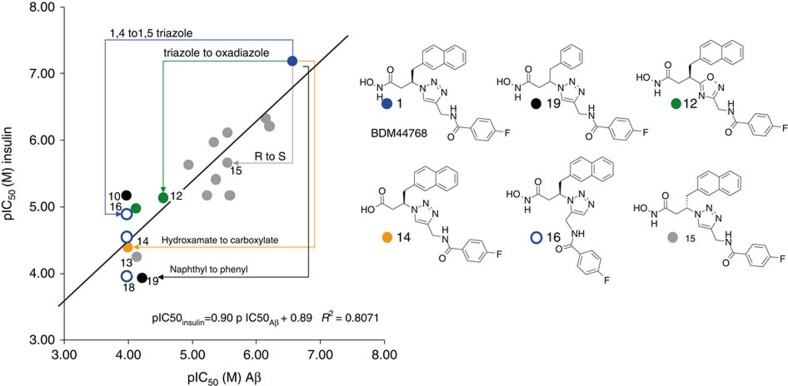
Figure 2. Structure–activity relationships as function of substrates.
Compounds with coordinates (x, y) that show pIC50s measured with respectively labelled Aβ and native insulin as substrates for hIDE: Naphthyl compounds: 1 (blue dots); other 1, 4-triazoles (grey dots); 1, 5-triazoles 16–18 (open blue circles); oxadiazoles 11–12 (green dots); carboxylate analogue of the most active hydroxamate 14(orange dot). Phenyl compounds : 10, 19 (black dots). The structures of six representative compounds are depicted on the right.

