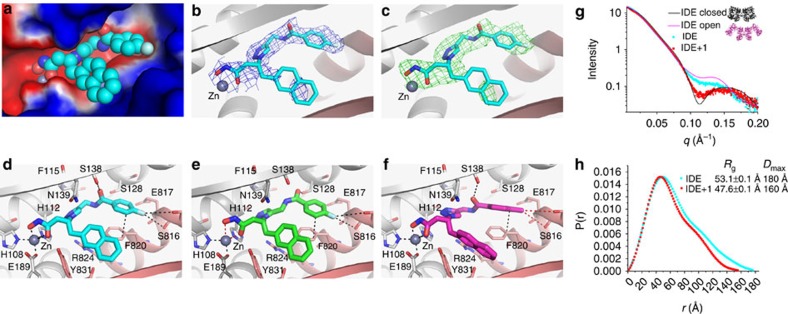
Figure 3. Structural and SAXS analyses of the interaction of hIDE with inhibitors.
(a–d) Detailed interactions of hIDE with compound 1 (BDM44768; PDB accession code 4NXO), (e) 10 (BDM44619; PDB accession code 4IFH), and (f) 16 (BDM71290; PDB accession code 4RE9) are displayed. hIDE is in surface (a) or ribbon (b–f) representation. Compound 1: C (cyan); Compound 10: C (purple); Compound 16: C (green); O (red); N (blue); F (light blue); zinc (deep grey sphere); N-terminal domain residues, (light grey); C-terminal domain residues (pink). Electrostatic potentials (a) that were calculated using APBS2.1, displayed using PyMol, and coloured from red (−1kT) to blue (+1kT). 2mFo-DFc map ((b) blue mesh), and mFo-DFc SA omit map ((c) green mesh) of hIDE bounded with compound 1 were contoured to 1σ and 2.5σ. SAXS analyses of the interaction of hIDE in the presence and absence of compound 1, depicted by their scattering profile (g: light scattering intensity as a function of q=(2πsinθ/λ in Å−1) and pair distribution function of scaterers in the real space derived from the scattering profile (h, including calculated radius of gyration Rg and the maximum linear dimension Dmax). The theoretical scattering profiles of closed (black) and open (magenta) states of hIDE dimer are shown in g. SAXS data fitting was performed with CRYSOL and P(r) distribution function was calcultated with GNOM.

