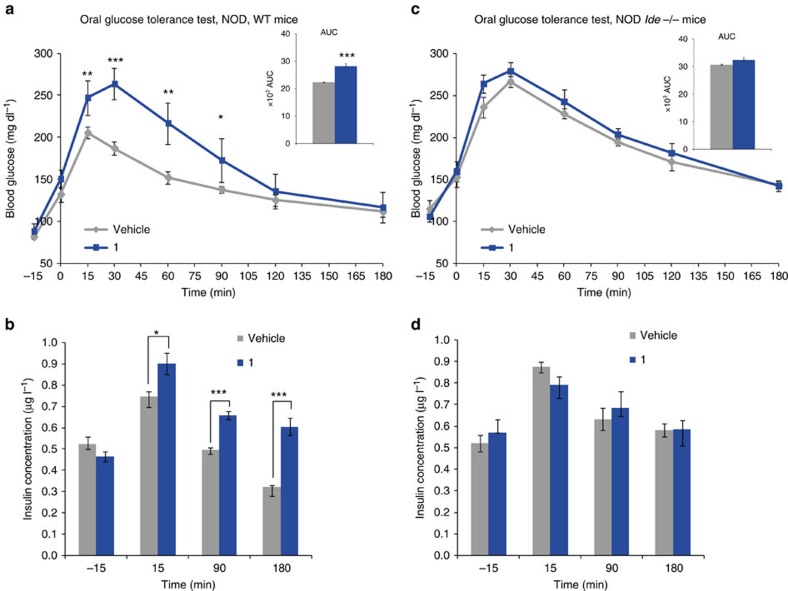
Figure 6. Acute in vivo effect of 1 on NOD mice in an OGTT.
(a,c) Mice (WT and Ide−/− NOD) were treated with 1 at 50 mg kg−1 (blue line) or with vehicle (grey line) intraperitoneally, and plasma glucose concentrations measured before (−15 min) and after the oral glucose challenge (3 g kg−1, at t=0), inserts represent AUC (−15 to 180). (b,d) Insulinaemia measured in the same animals as in (a,c) NOD and Ide−/− respectively (1: blue bars; vehicle: grey bars) measured at the indicated time points. One out of three independent experiments is shown. Data are mean±s.e.m (n=6 mice per group). two-sided t-test *P<0.05; **P<0.01 ; ***P<0.001.

