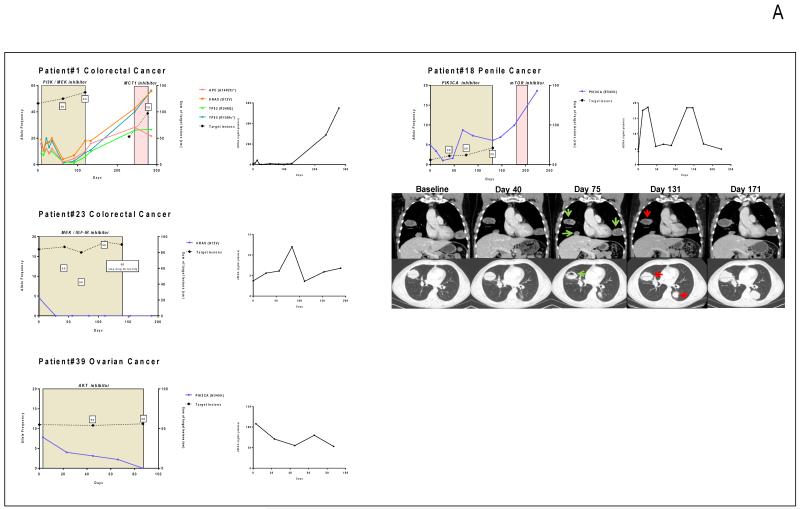
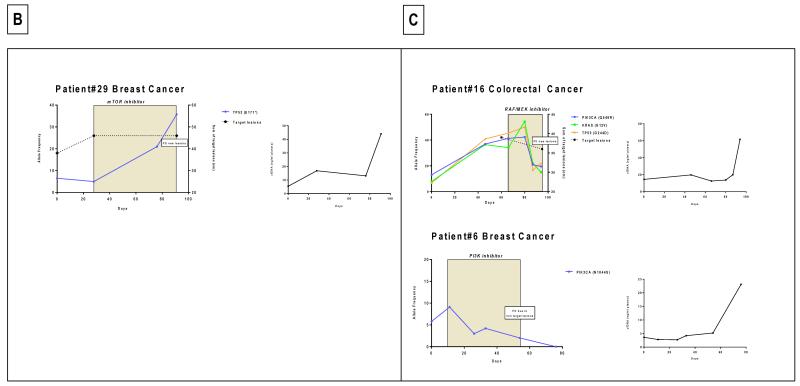
Figure 1.
Monitoring of somatic genomic alterations in plasma during targeted therapy. Allele frequency (AF) of the identified mutations is represented on the left Y-axis while the sum of the target lesions on CT scan is represented on the right Y-axis. SD: stable disease according to RECIST criteria; PD: progressive disease. The colored box depicts the time on treatment. The second graph depicts the evolution of cfDNA concentration during this time frame in ng/ml of plasma. A. Patients with decreasing AF during therapy. B. Patients with increasing AF during therapy. C. Patients with mixed or discordant AF changes during therapy.


