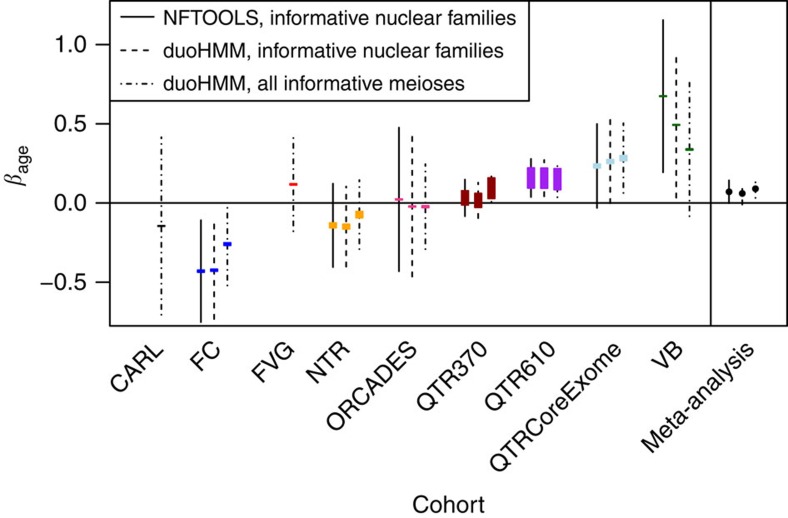
Figure 2. Estimates of the maternal age effect from linear mixed models.
The length of the coloured boxes is proportional to sample size. The black lines show 95% confidence intervals, and the line type indicates which data set was used. On the far right are estimates from the meta-analysis, indicated as points with their confidence intervals. The sample sizes for each cohort are listed in the second last column of Table 1.

