Figure 2.

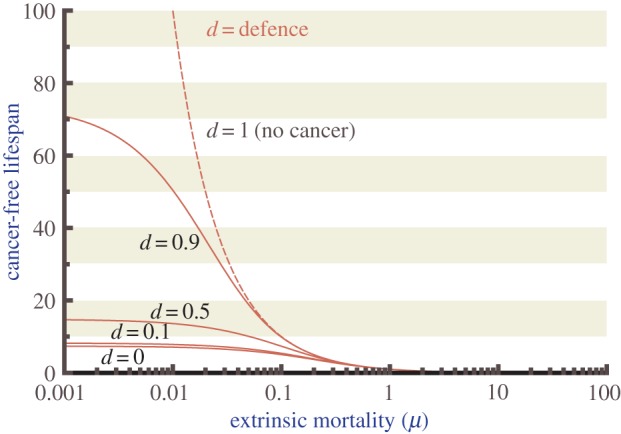
The effects of cancer defences on lifespan are strongest when extrinsic mortality is low. Model predictions for the expected duration of cancer-free life, which can be ended by either cancer or through other sources of mortality, as a function of extrinsic mortality μ, plotted for different values for defence effort d as indicated on the graph (lowest curve: d = 0, then d = 0.1, followed by d = 0.5 and d = 0.9). The dotted line gives the expected lifespan assuming no cancer ever occurs (d = 1). The impact of defence on lifespan varies from strong when extrinsic mortality is low, to negligible when lifespans are short owing to causes other than cancer. Parameters as in figure 1. Note that neither α nor β impact the graphs in figure 1 or in this figure.
