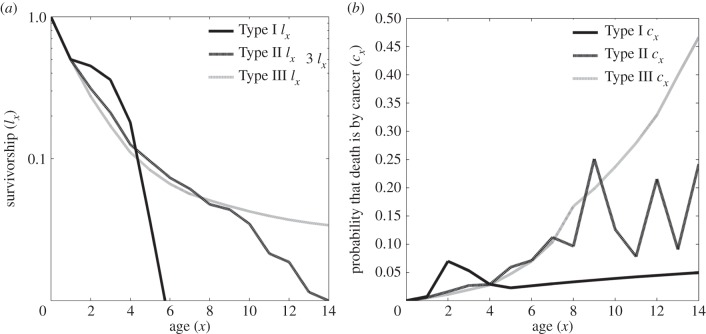
Figure 1.
The effect of survivorship curves (plots of age x versus ln(lx)) on the likelihood that a death during age x is caused by cancer rather than some other mortality source, cx. Figure 1a shows the three survivorship curves for the beaver model, where the Type II survivorship curve (relatively constant death rate with age) is our baseline model. The Type I (increasing death rate with age) and Type III curves (declining death rate with age) are modifications to the baseline where the values of lx have been adjusted to keep life expectancy and net reproductive rates relatively constant. The Type III curve results in the highest optimal level of cancer suppression, u* = 0.111, and the lowest lifetime likelihood of dying of cancer, C = 0.0184; while the Type I is opposite (u* = 0.100, C = 0.0239). As shown in figure 1b, this is despite the fact that the age-specific cause of death from cancer rises most steeply for the Type III curve and least for the Type I. This is because with a Type III curve, the death rate from other causes declines with age, whereas the likelihood of dying from cancer always increases with age in our model regardless of survivorship curve. The gyrations in figure 1b for Type II survivorship are because we have used actual published data for beaver survivorship that has presumably stochastic variation in age-specific mortality from other causes with age—hence for age classes with unusually low death rates, a high proportion of those deaths shall be from cancer.

