
Figure 2.
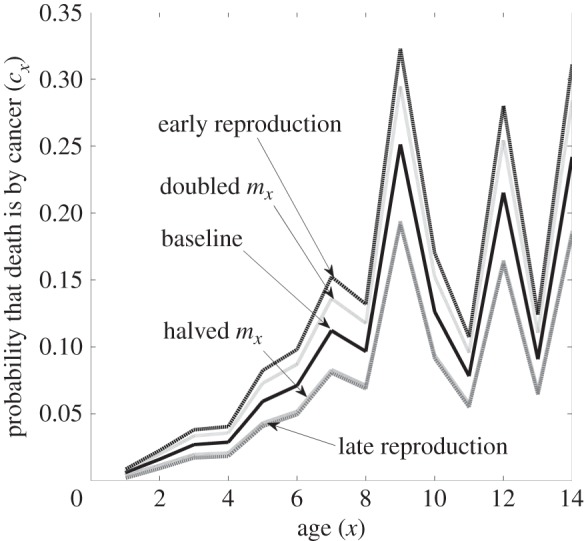
The effect of the fecundity schedule, mx, on the likelihood that a death during age x is caused by cancer, cx. We show the baseline beaver model (same line as the Type II in figure 1b) and four modifications where: (1) fecundity is halved for all age classes, (2) fecundity is doubled for all age classes, (3) fecundity has been front-loaded to earlier age classes while holding net reproductive rate, R0, equal to the baseline and (4) fecundity has been back-loaded to later age classes while holding net reproductive rate equal to the baseline. Table 1 shows the effects of these scenarios on the optimal level of cancer suppression and the lifetime likelihood of dying from cancer. Early reproduction, while holding R0 constant, results in the highest fraction of age-specific deaths occurring from cancer, followed by a halving of all values of mx. Late reproduction, and doubling of the values of mx results in the lowest values of cx. Perhaps coincidentally, these last two scenarios resulted in the same curves because they select for the same optimal level of cancer suppression.